Power BI — analysing the MEW-01 measurement history from an Excel file
How to get MEW-01 measurement data into Excel so that you can later show it as readable charts and dashboards in Power BI, step by step.
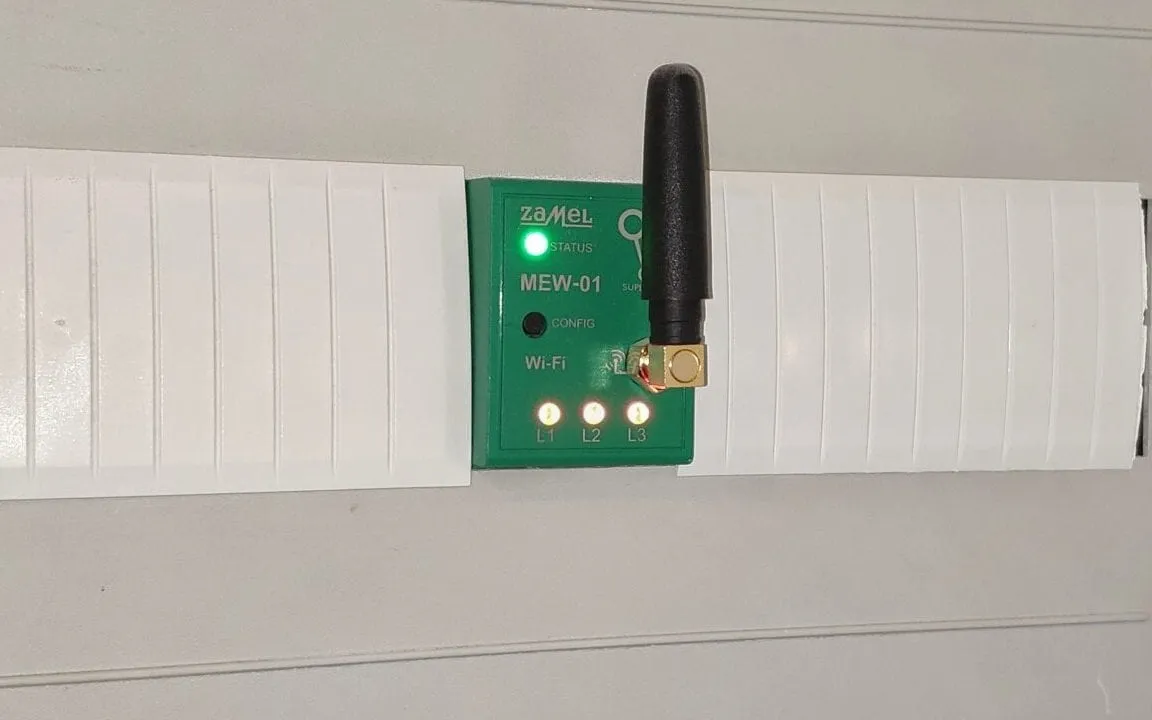
Table of contents
I work at ZAMEL. The devices described on this blog were made available to me by the company. All opinions and ratings are my own - the company had no influence on the content of the published articles.
In earlier posts I showed how to download electrical grid parameters and energy usage data from the MEW-01 device with the REST API. This time I will show how to start analysing the MEW-01 measurement history in Power BI.
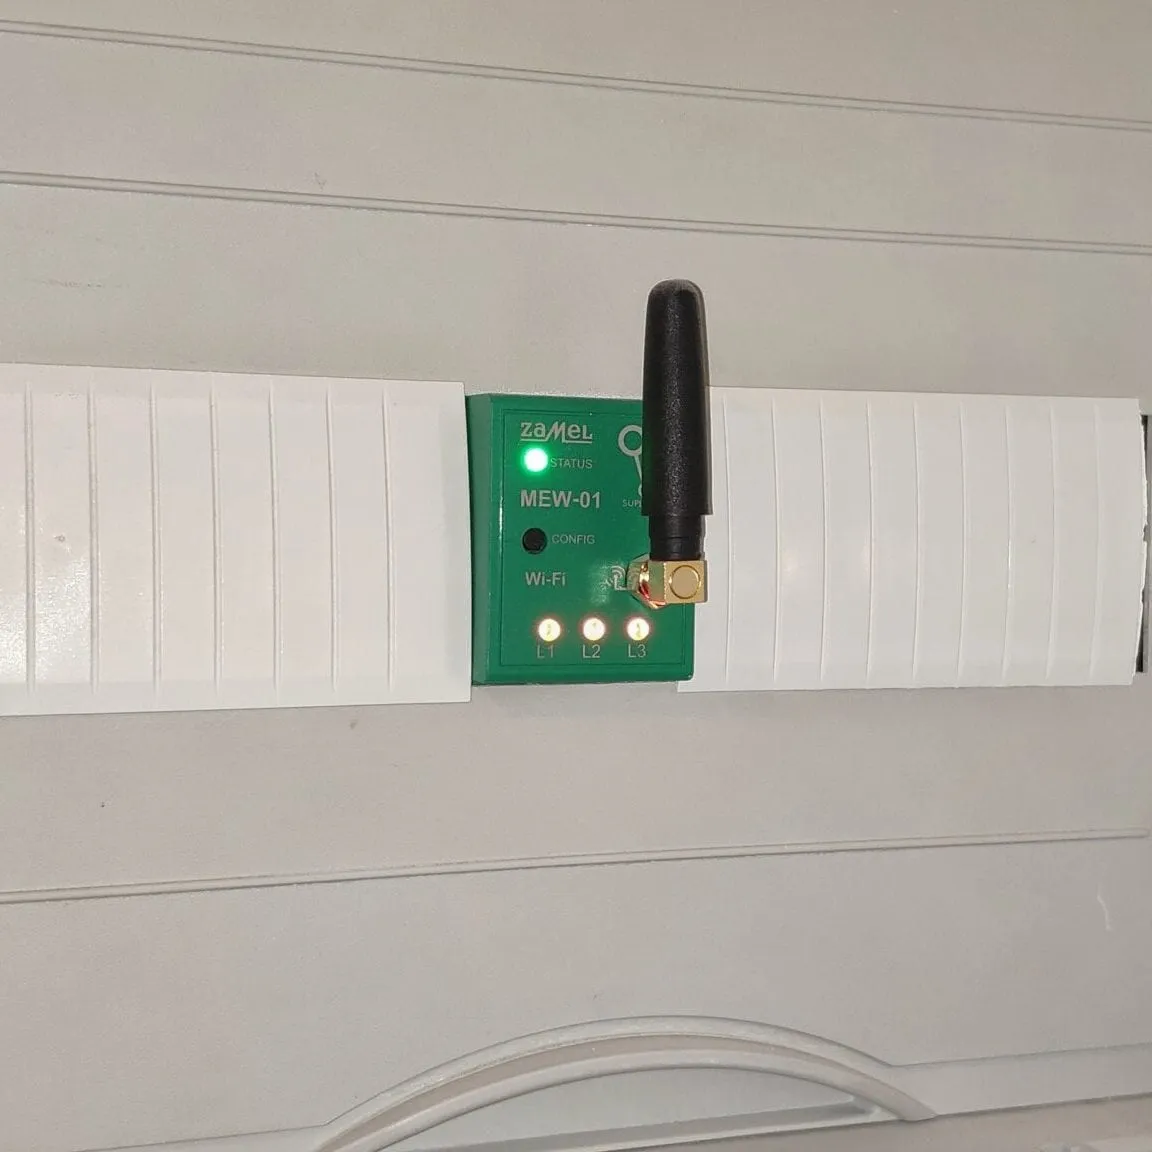
MEW-01 electricity monitor
Power BI is a program for building interactive visualisations and data presentations that are simple enough to turn into reports and dashboards. In this article I show how to use it with the measurement history of the MEW-01 device (an electricity monitor made by ZAMEL).
How to analyse data from the MEW-01 electricity monitor in Power BI Desktop?
For this article I use Power BI Desktop. You can download the program here: https://powerbi.microsoft.com/pl-pl/desktop/
1. First we log in to our Supla Cloud account. We go to https://cloud.supla.org/login and fill in the credentials. We click the Log in button.
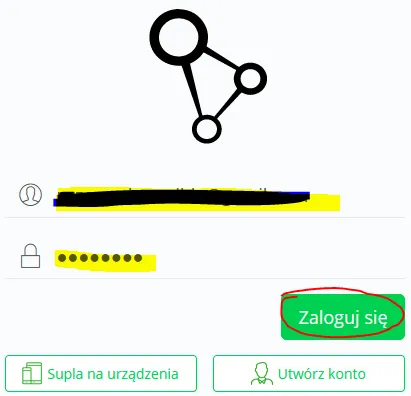
Supla Cloud account - logging in
2. In the next step we go to the My Supla tab. We find our MEW-01 measuring device and open its settings. Here we choose the option that lets us download the measurement history. We press the Download measurement history button and save it on the computer. It will be a packed .zip file.
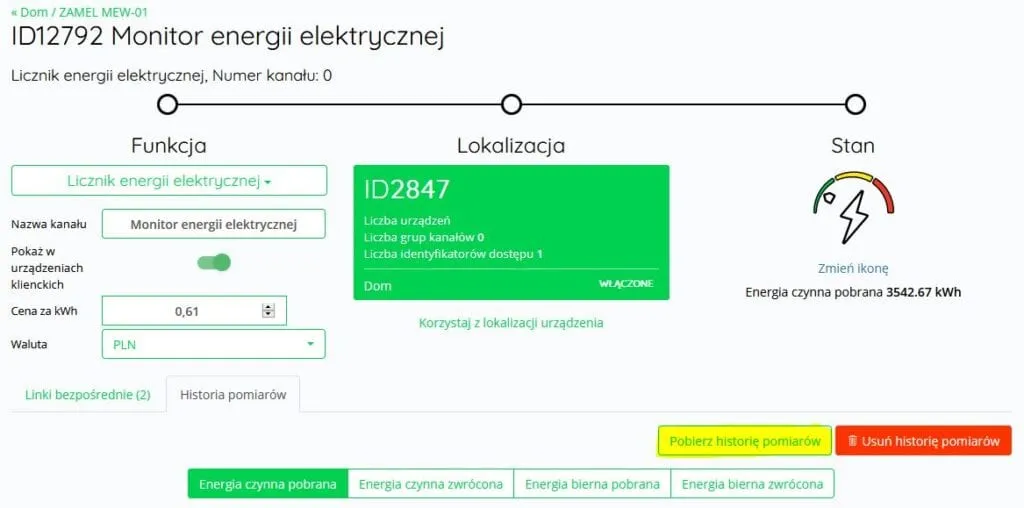
MEW-01 - download the measurement history
3. Now it is time to unpack it. We will use the CSV file we get in Power BI. That file holds the whole measurement history from our device, which we can use for all kinds of analysis.

MEW-01 - measurement history in a CSV file
4. We start Power BI Desktop. Once it is running, we press the Get data button.
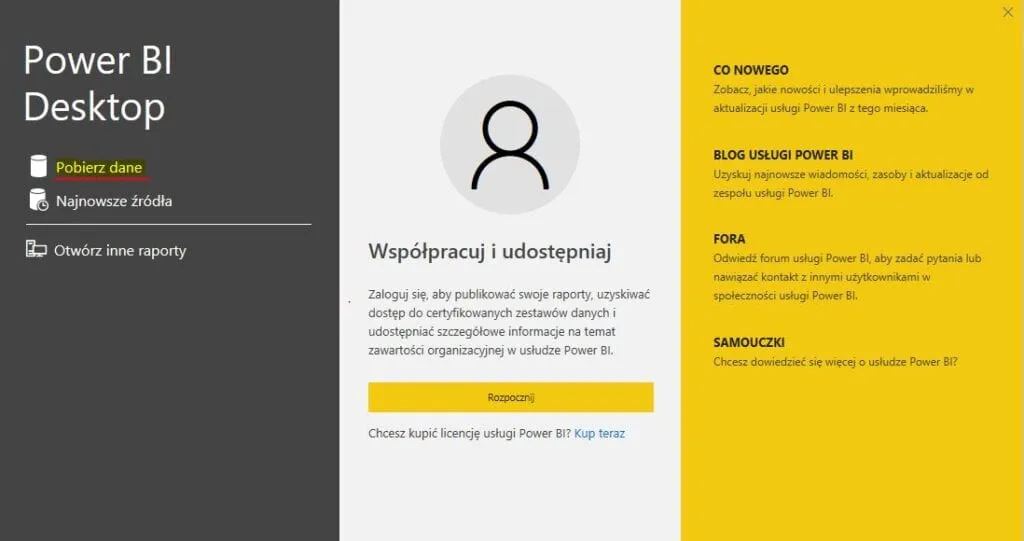
Power BI Desktop - get data
5. We point to the file we want to load into the program. In our case it is the CSV file with the measurement history. We choose Text/CSV from the list and press Connect.
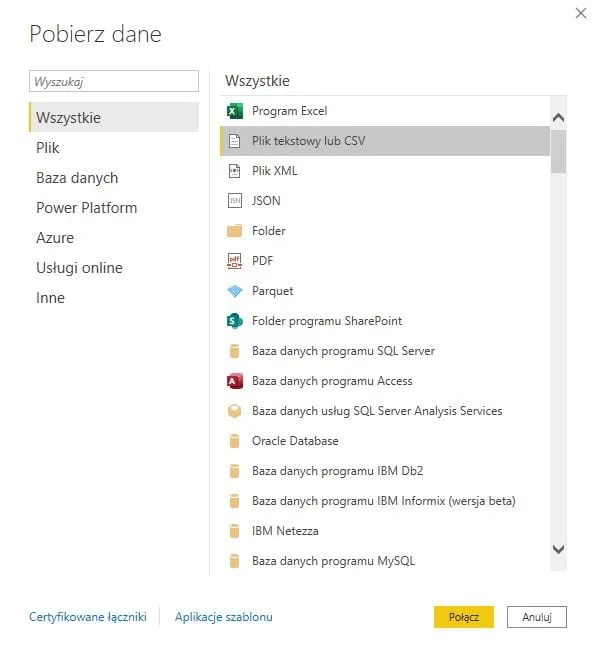
Power BI Desktop - choosing a text or CSV file
6. After that we see a window where we point to the file with our measurements.
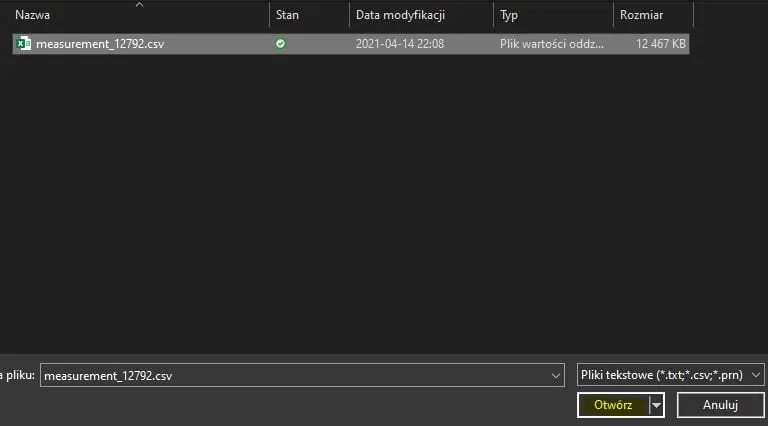
Power BI Desktop - choosing the CSV file from the disk
7. A table with the first transformation of our data appears. We set the encoding to UTF-8 and choose the Transform Data button.
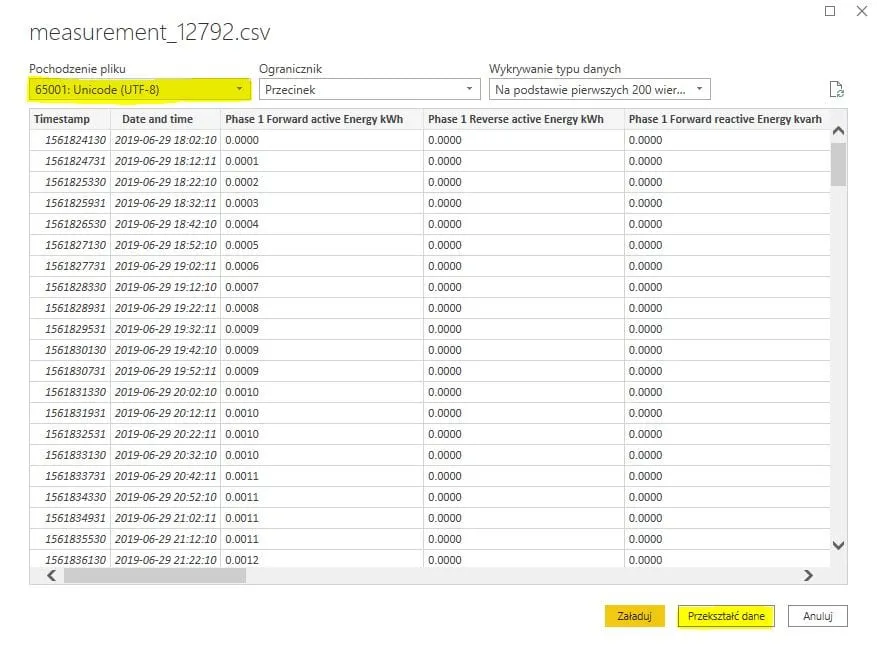
Power BI Desktop - transforming the CSV file data
I suggest making yourself a good cup of tea now. There is some fun with tables ahead of us. :-)
8. Time to change the values in the columns. We will clean up the dots.
In every column with measurement results we have to change the values to commas. We select all the columns and choose the Replace Values option.
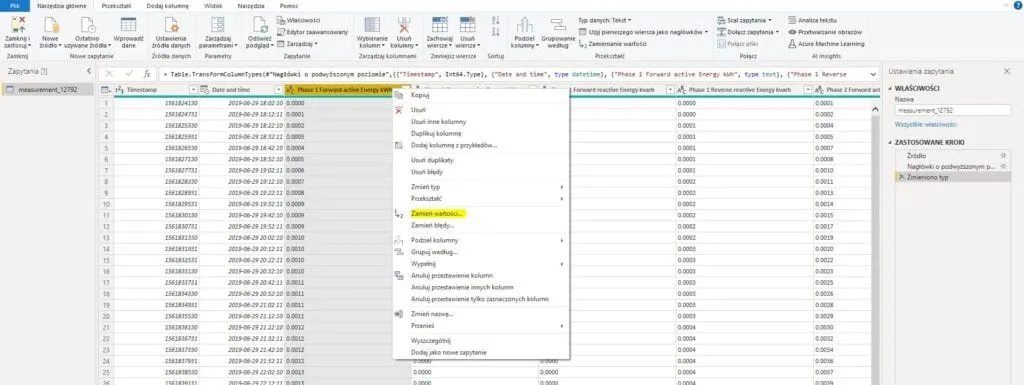
Power Query - replace values
9. A window appears where we say which value we are looking for and what we change it to. We fill it in as in the picture below and press OK.
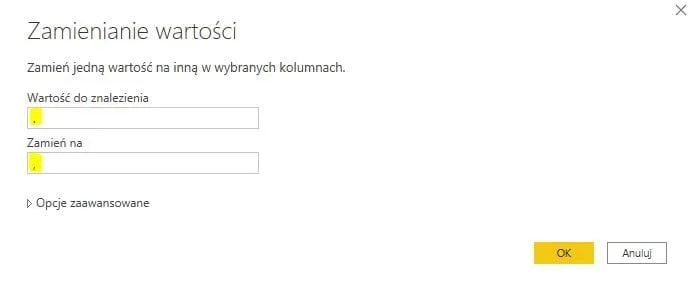
Power Query - replacing values in the columns, dots into commas
10. The values in our columns have changed. Commas appeared where the dots were.
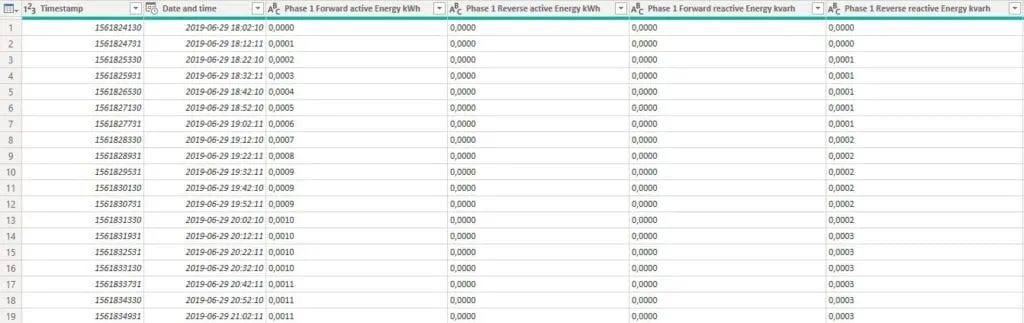
Power Query - changed values in the columns
11. Now we repeat the same action for all the columns. We have to change the data type to decimal numbers so that there are no errors.
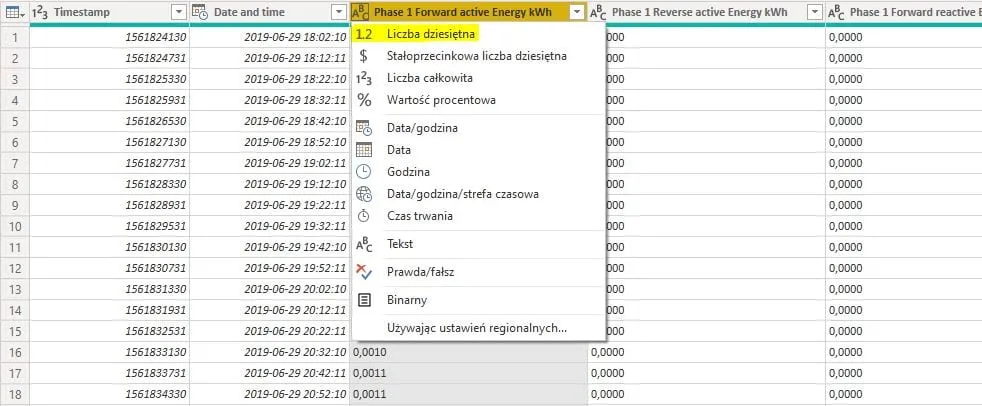
Power Query - changing the data type to a decimal number
12. This is how the columns we want and their data types look.
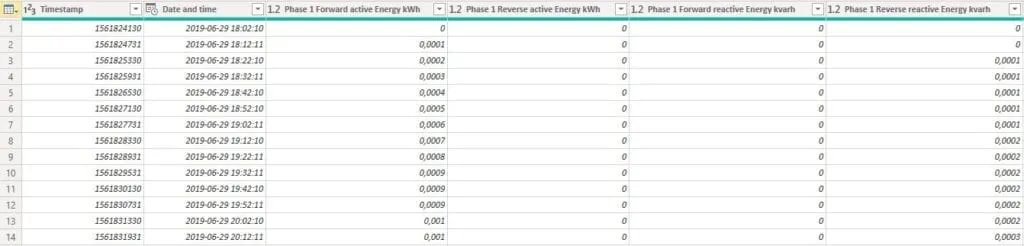
Power Query - changed data types in the columns
13. The measurement data in the downloaded CSV file is cumulative. That means importing the data at this point would be misleading. What we care about is the difference between the 10-minute values recorded by the MEW-01. How do we do that?
We add an index column starting from 0.
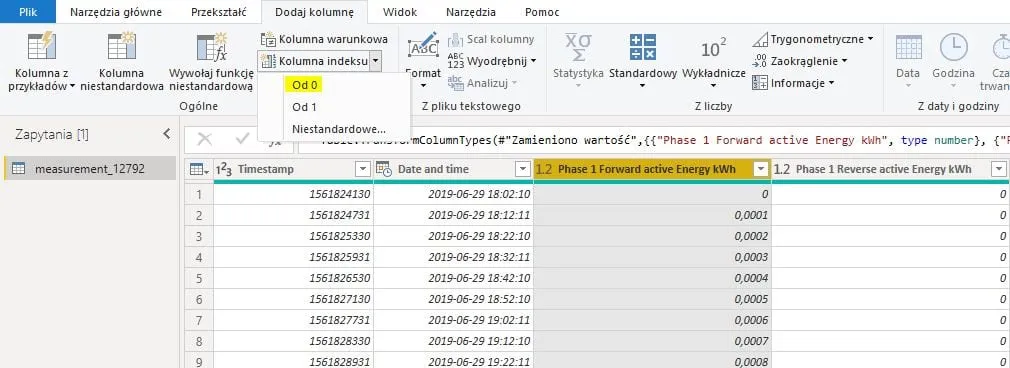
Power Query - index column from 0
14. Then we add another column starting from the number 1.
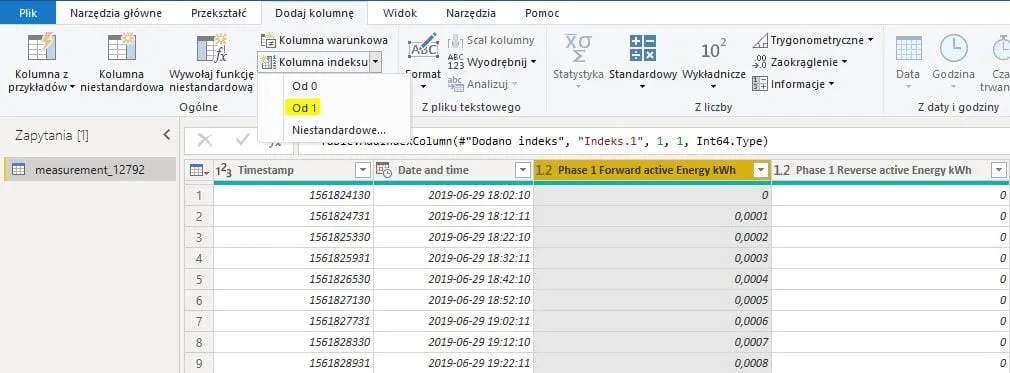
Power Query - index column from 1
15. The new columns appear in a row on the right. We also have to change their data type to decimal numbers.
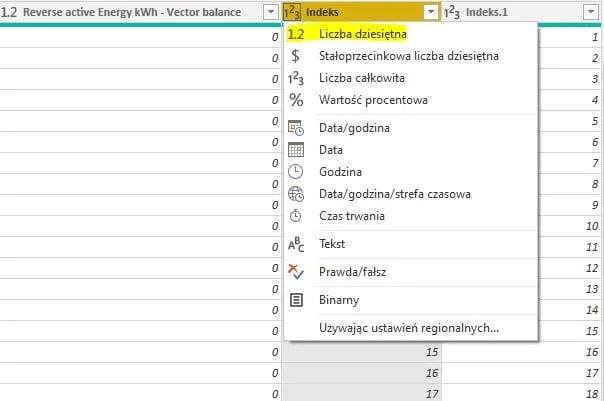
Power Query - changing the data type in the index columns
16. Once the change is done correctly, we will have the values shown below (the last 2 columns).
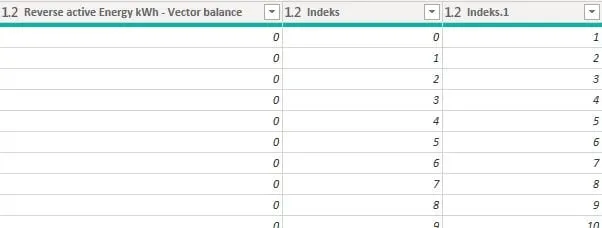
Power Query - changed data types in the index columns
17. Now it is time to merge queries.
We choose the Merge Queries option and set the values as in the picture below. In the first part we use the index starting from 0 as the key of the first table, and in the second part the index starting from 1.
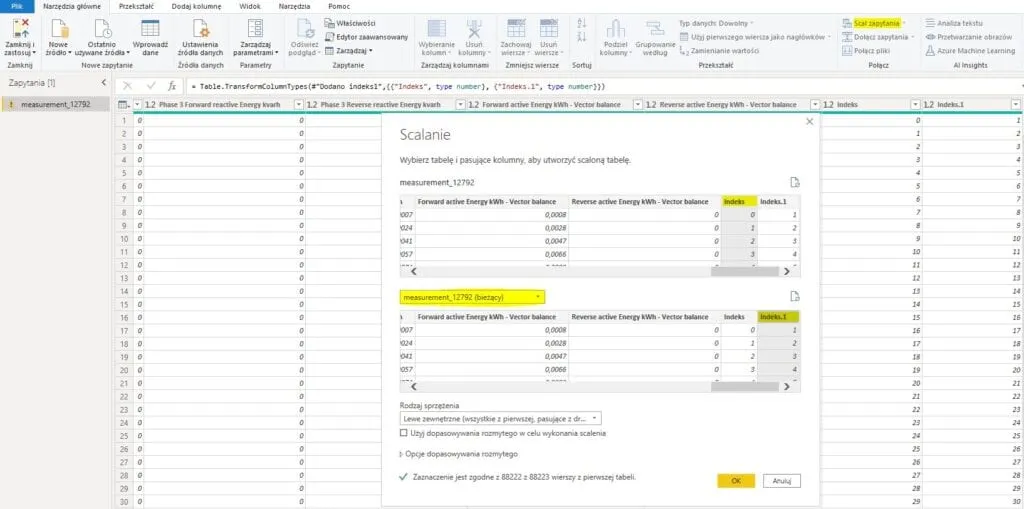
Power Query - merge queries
18. After the merge a table appears that we can expand. We press the button marked in red.
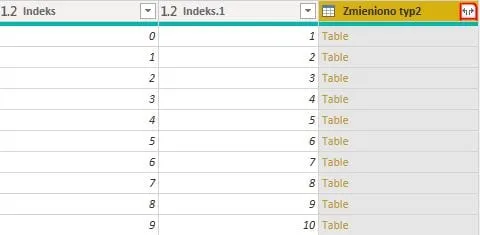
Power Query - expanding the table
19. Time to pick the columns we care about from the list. I deliberately left out the columns marked in yellow. There is no need for them, because no calculations will be done on them.
At the end, we clear the option: “Use original column name as prefix”.
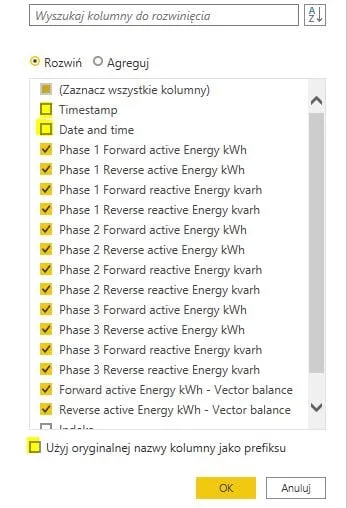
Power Query - expanding the selected columns
20. New columns marked with “.1” will appear in Power Query. We will need them to calculate the differences between rows.
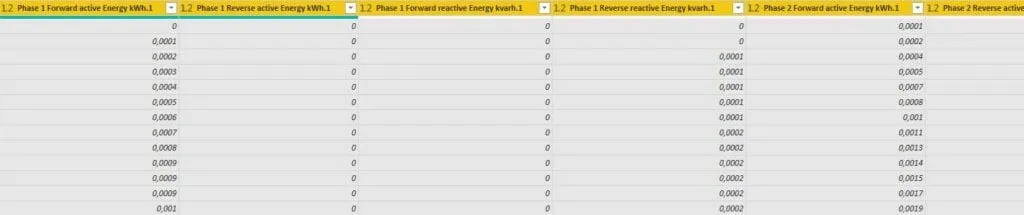
Power Query - expanded columns marked with 1
21. We move on to calculating the differences in the individual rows.
We create custom columns, keeping their names in mind. When we choose this option, a window appears where we write the calculations. We take the difference between the “old and the new table” for each column. We repeat this for every column we care about (Phase 1 - active energy drawn and so on)
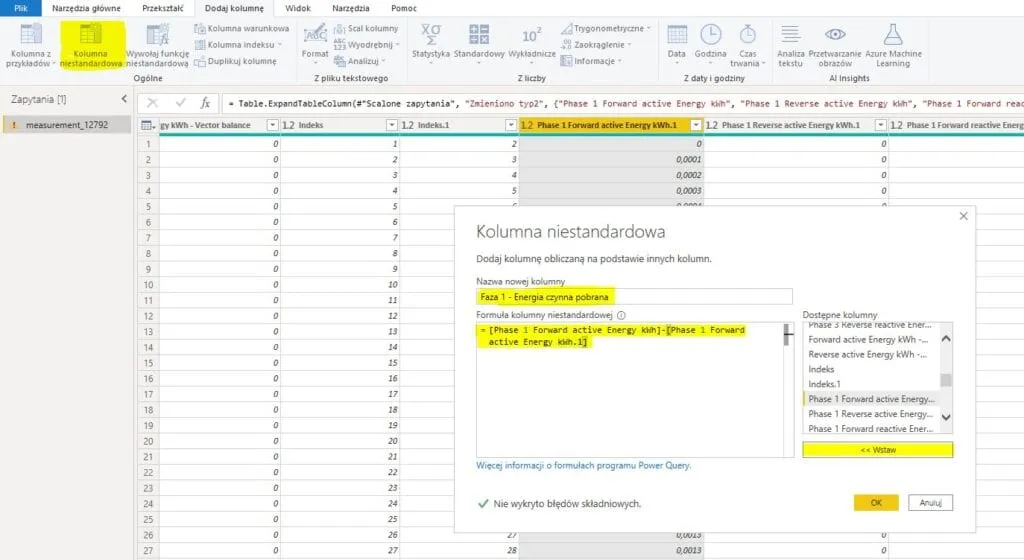
Power Query - inserting custom columns
22. For the new columns we again set the data type to decimal number.
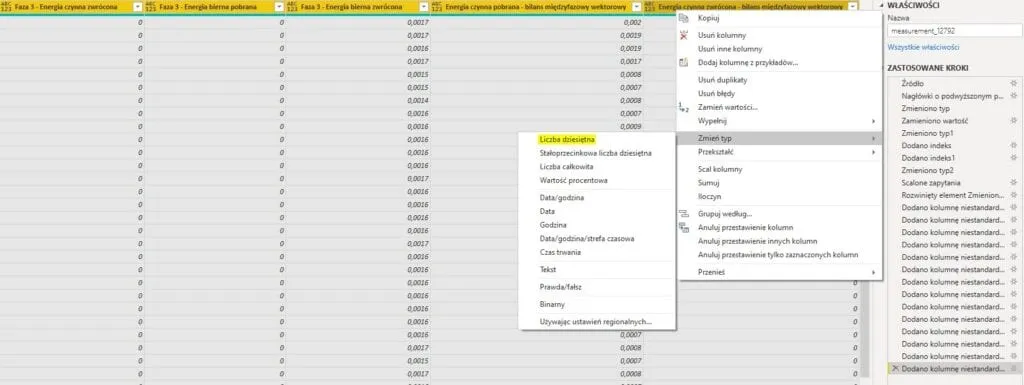
Power Query - inserted custom columns and the change of their data types
23. Now it is time to clean up.
The columns we no longer need - we delete. Notice that the steps we take for our file are listed on the right. In the future, when we refresh the data, we will see the modified table ready to go. All we have to do is download the new measurement history. Paste it into the folder, replacing the old history, and refresh the data.
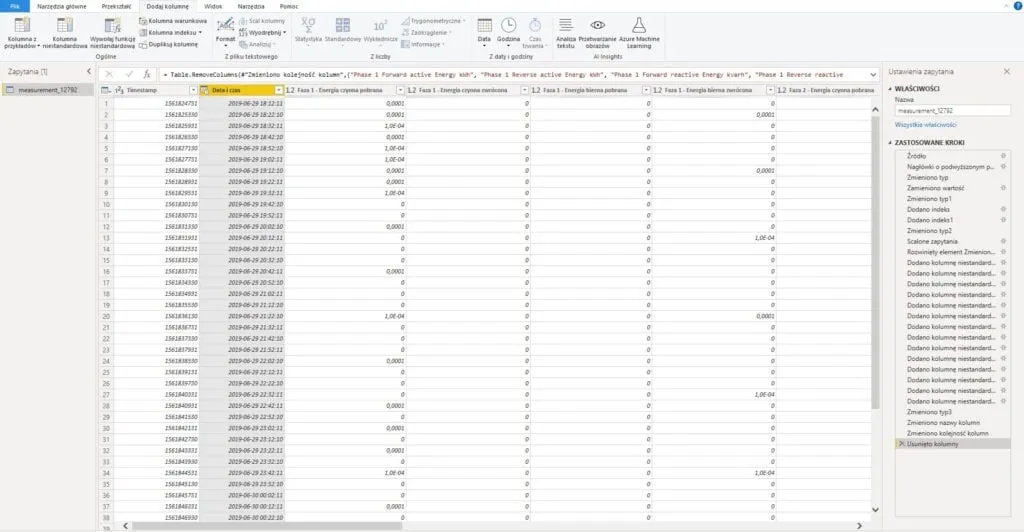
Power Query - removing the columns we do not need and renaming - Date and time
24. Time for the last step.
We close Power Query and apply all the steps we took for our query. :-)
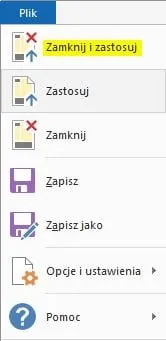
Power Query - close and apply
25. It is all done.
Our query has been prepared correctly. The data is available in Power BI.
Now the most enjoyable part. We start playing with charts and visualising our data. I promise the fun is only starting.
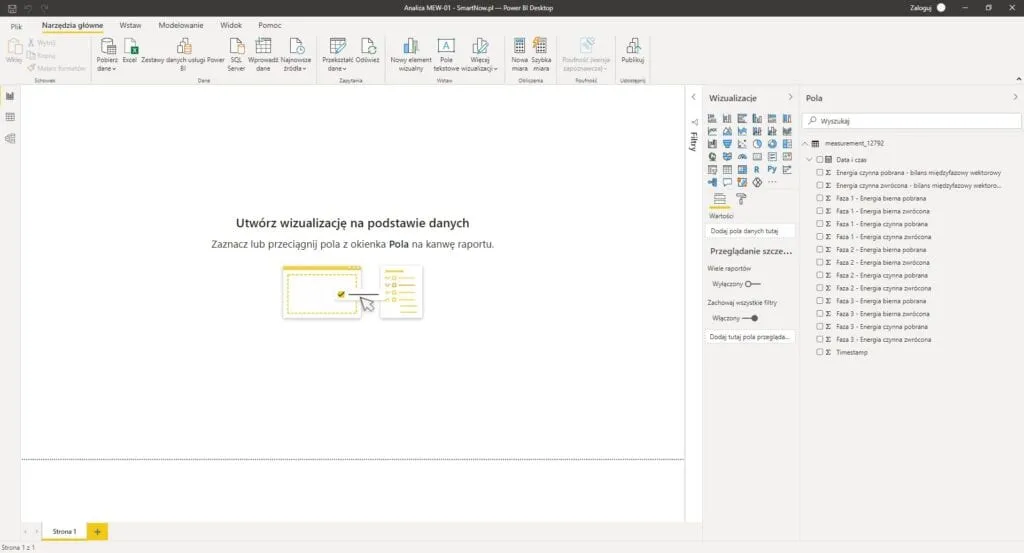
Power BI - MEW-01 analysis
Below I show the results I got at home after tweaking my query a bit. I will probably come back to this topic in the future. All you have to do is ask for it in the comments.
Remember to check the data yourself, though. I could always have made a mistake.
And here are the examples:
Electricity usage balance of the ZAMEL MEW-01
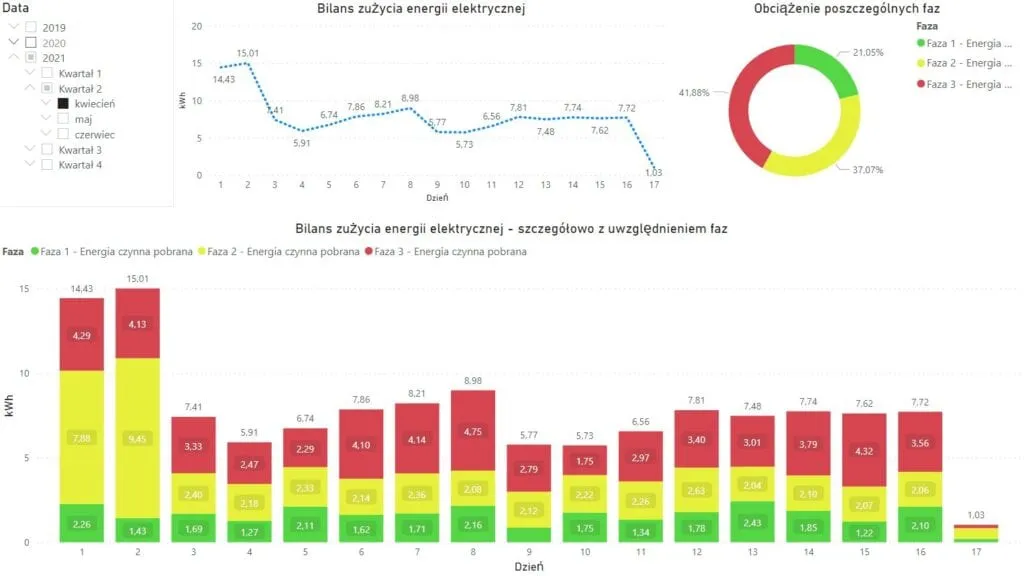
Power BI - analysis of measurement data from the MEW-01 - screenshot
Ranking of hours - energy usage
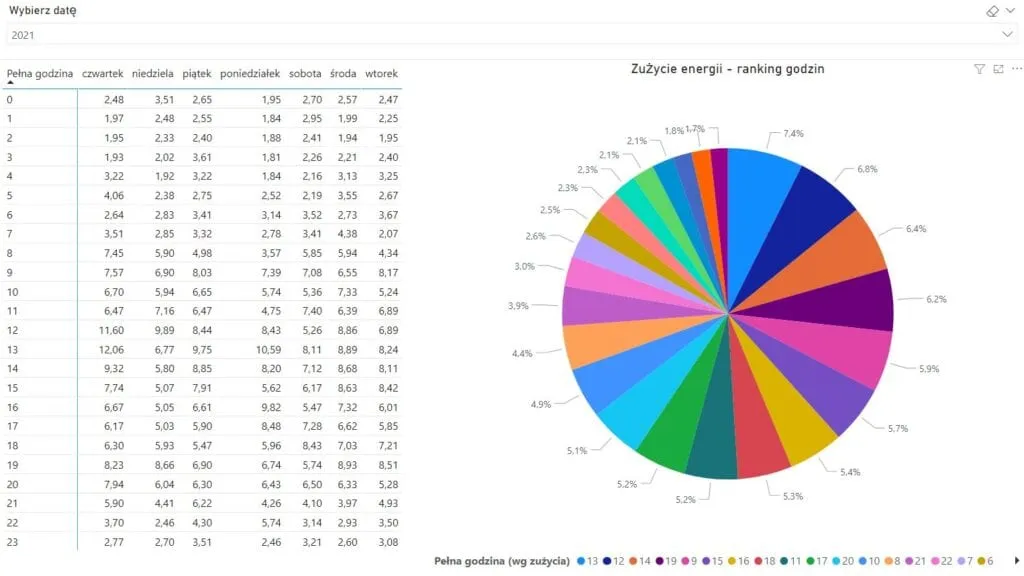
Power BI - MEW-01 - ranking of hours by energy usage
Electricity usage over time
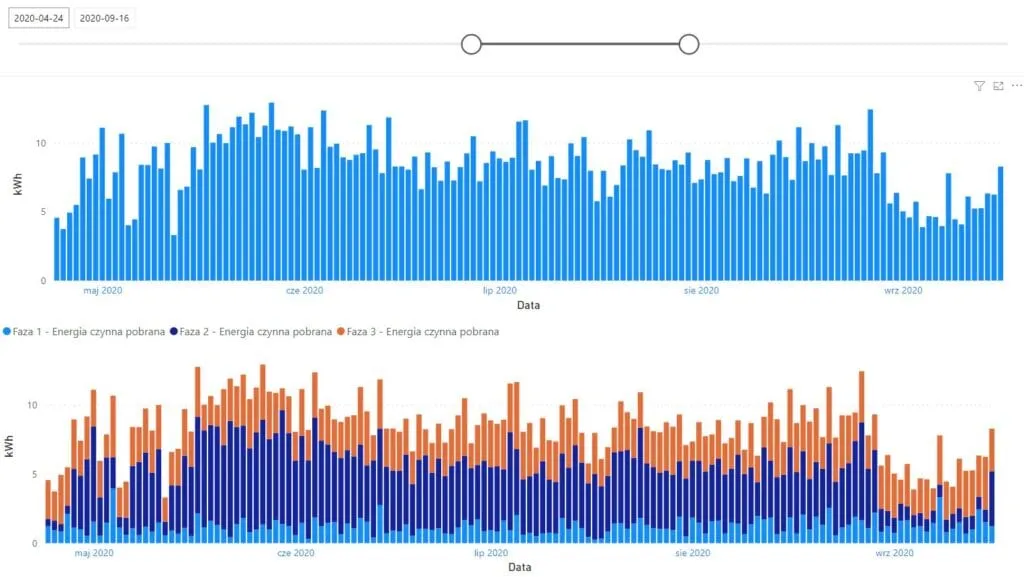
Power BI - MEW-01 - energy usage over time
That is all for today. Thank you for making it to the very end.
If you would rather set this up together with me, book an online Supla setup session. You share your screen and I guide you step by step. Sessions are in Polish.
Try my online measurement analyser too. It loads a CSV file with the measurement history of an energy monitor (MEW-01/MEW-02 from Supla Cloud) and shows usage in the ranges you pick, the hourly profile and a comparison of the G11 and G12 tariffs — everything is calculated locally in your browser, with no data sent anywhere. This is a beta version, so give it a try: Energy monitor measurement analyser.
New posts also go out over RSS — no email address needed. Subscribe via RSS