MEW-01 energy monitor — downloading the electricity usage history from the server to Excel – part 2
Learn how to pull the last 5,000 electricity usage records from the MEW-01 device out of the Supla server and into MS Excel with the REST API.
I work at ZAMEL. The devices described on this blog were made available to me by the company. All opinions and ratings are my own - the company had no influence on the content of the published articles.
In the first part of the article I showed how to download the most recent parameters of the electrical grid using MS Excel. The Supla server can do a bit more, though. We can also download our usage history from the MEW-01 device by ZAMEL.
With REST API queries we can download up to the last 5,000 records. In this part of the post I want to show how to do it.
Let’s get started.
1. We open MS Excel.
2. We log in to our Supla account: cloud.supla.org.
3. Once logged in to our Supla account, we go to the Integrations tab:
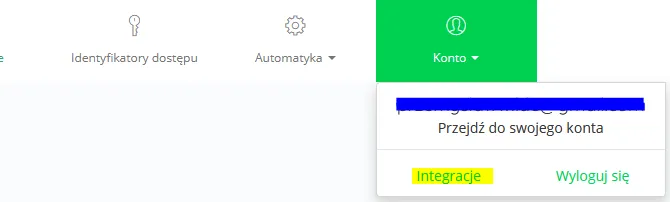
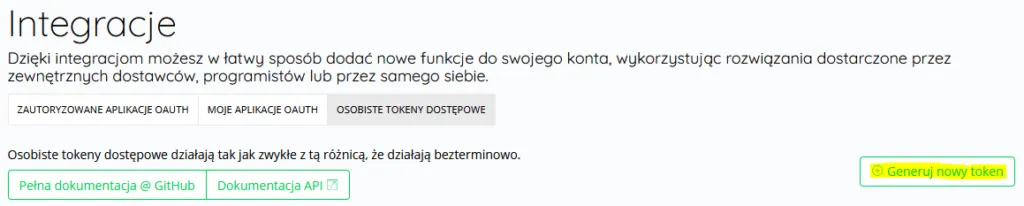
4. Then, in the Integrations tab, we choose Personal access tokens and generate our token:
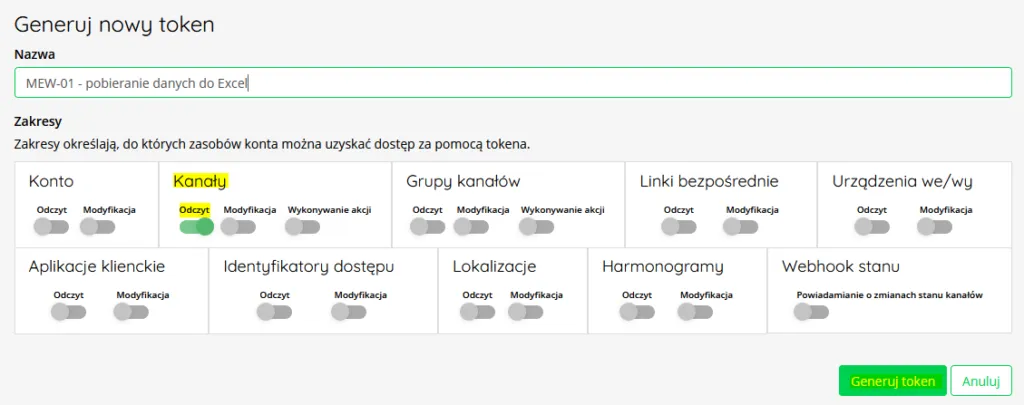
5. We generate a personal access token with permission to read channels:
6. After choosing Generate token our code should appear, and we save it in a safe place:
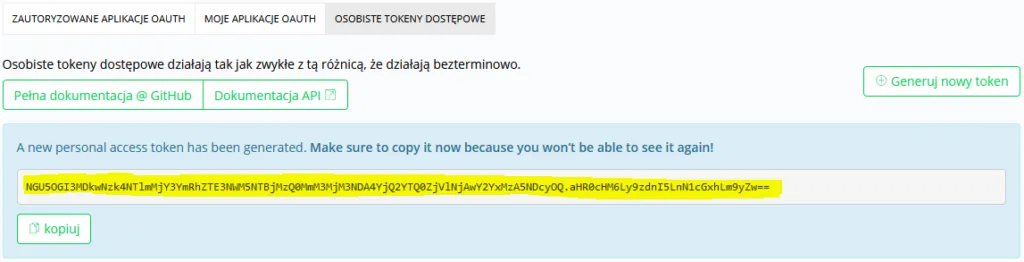
7. In the API documentation tab we can find the command that reads the electricity usage data from our MEW-01 device:
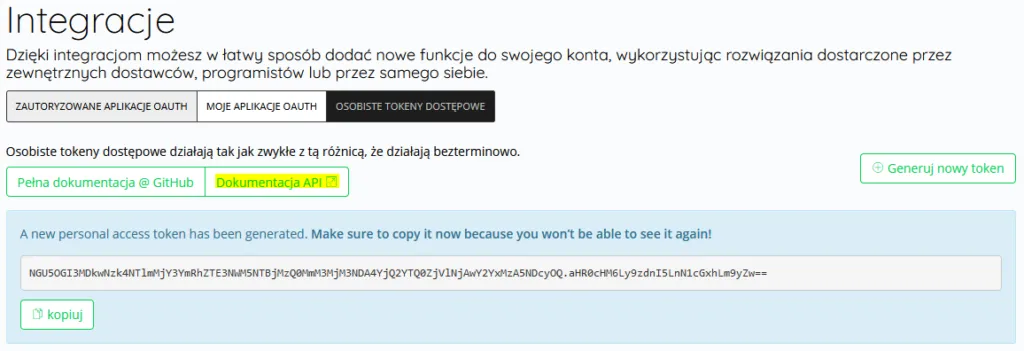
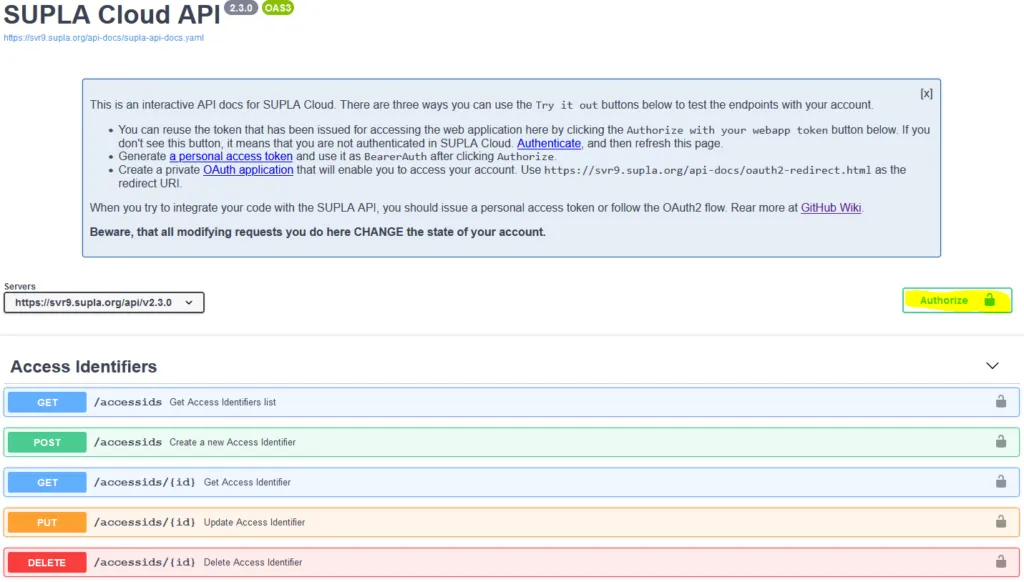
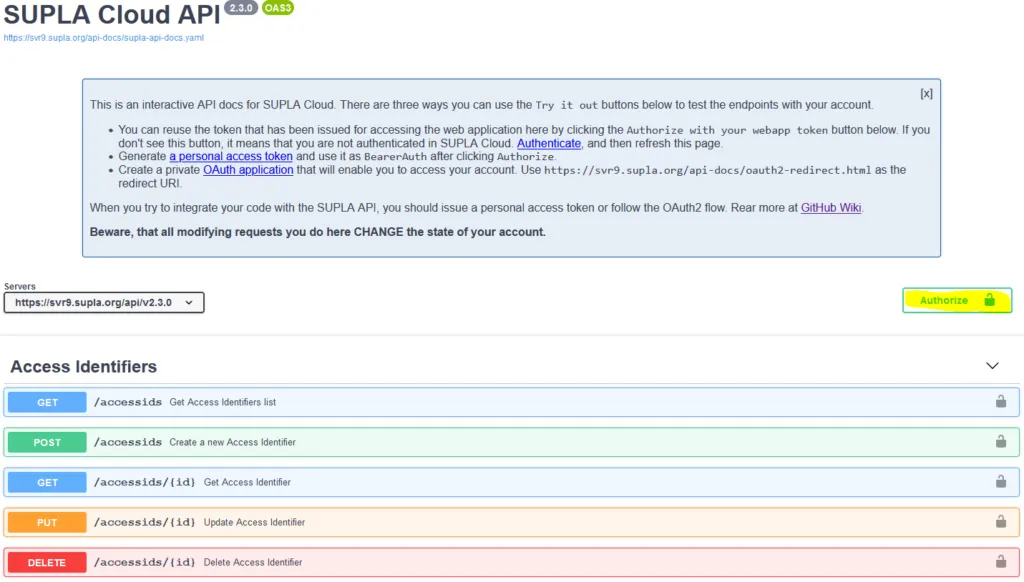
8. We open that tab**.** The full documentation appears, where we can see the whole library of queries we can send to the SUPLA server. First of all I suggest testing our personal access token. To do that we click the Authorize button:
9. We paste our token into the BearerAuth (http, Bearer) field and click Authorize:
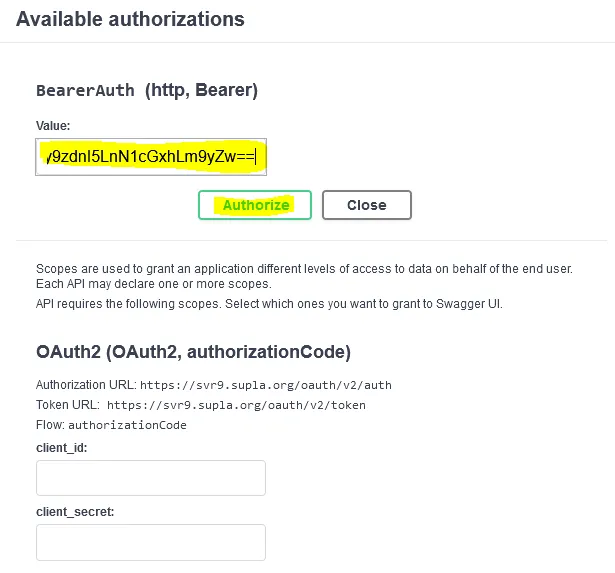
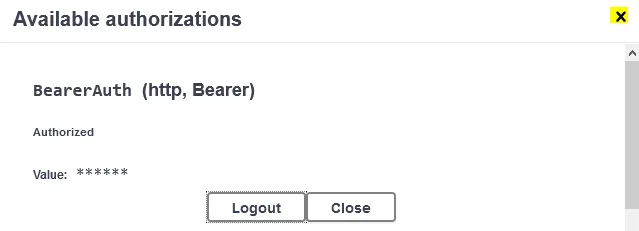
10. After logging in correctly we will see a window that we can already close:
11. In the API query library we can go to the command:
GET/channels/{id}/measurement-logsGet measurement logs.
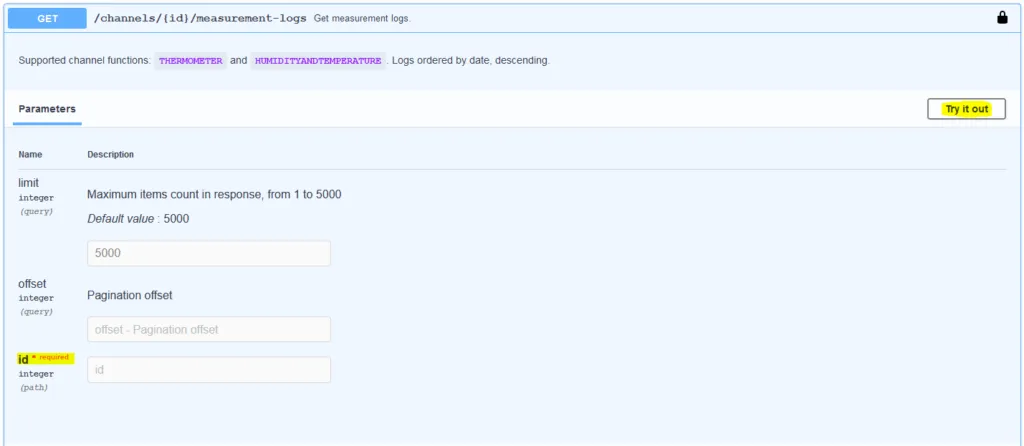
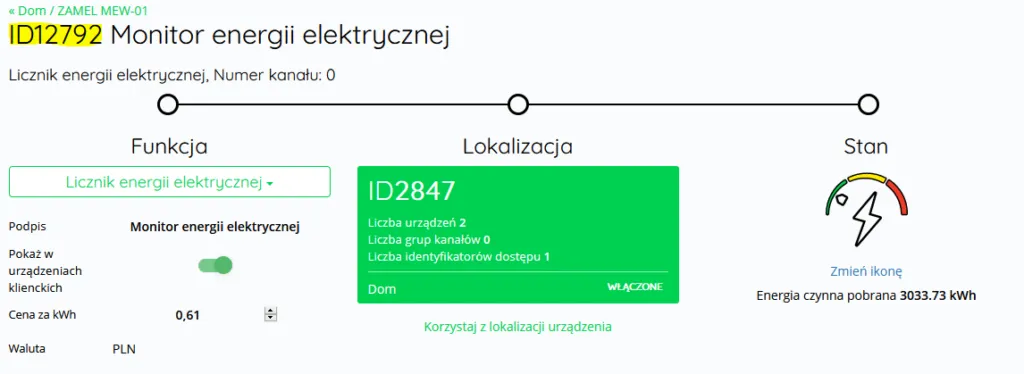
As you can see, we will need the ID number of our MEW-01 device. We take it from the My Supla tab, opening the details of the MEW-01 device. In my case it is: 12792
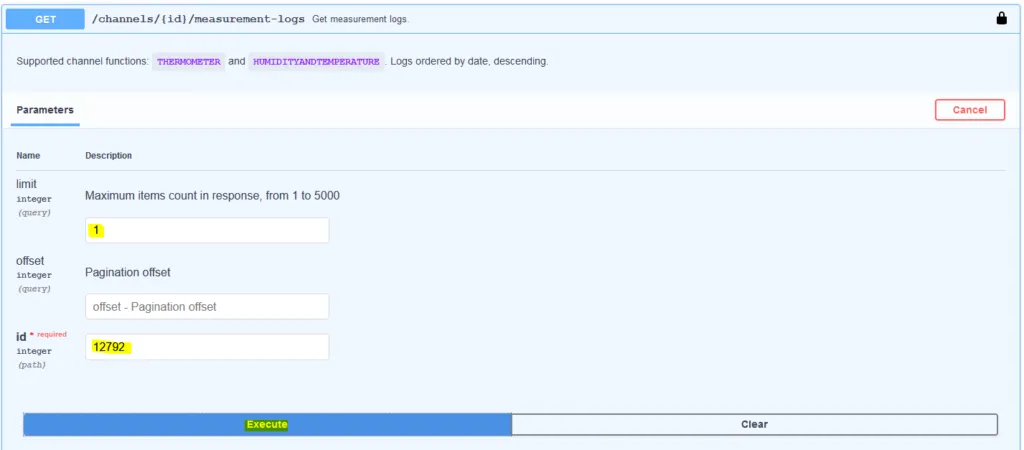
We fill in the data as in the picture below. For the test we pull only 1 entry, and we set that number in the limit field. At the end we click the Execute button.
12. After running the query correctly we should get a result:
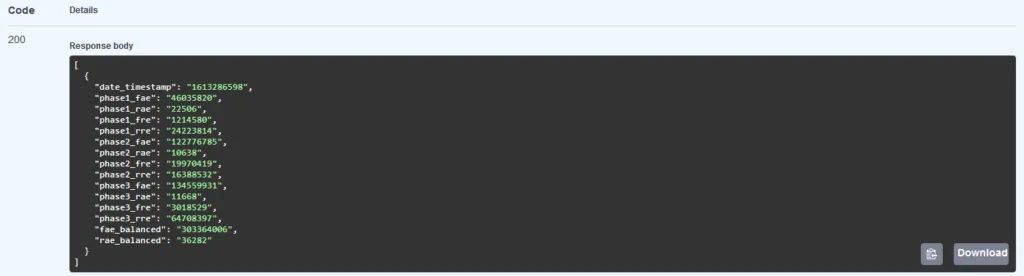
13. Now it is time to use this data in MS Excel. We will need the data from the window. I suggest saving it in a notepad:

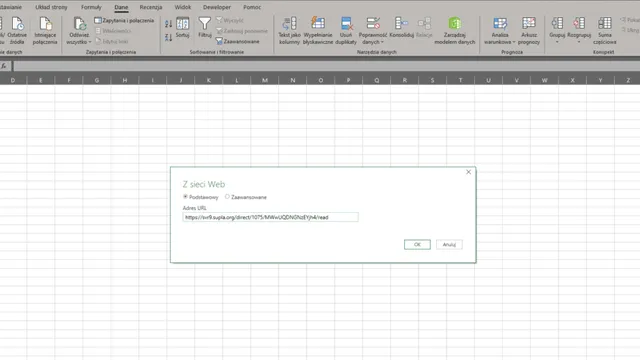
14. In Excel we go to the Data tab and choose From Web. In this window we are interested in the Advanced queries:
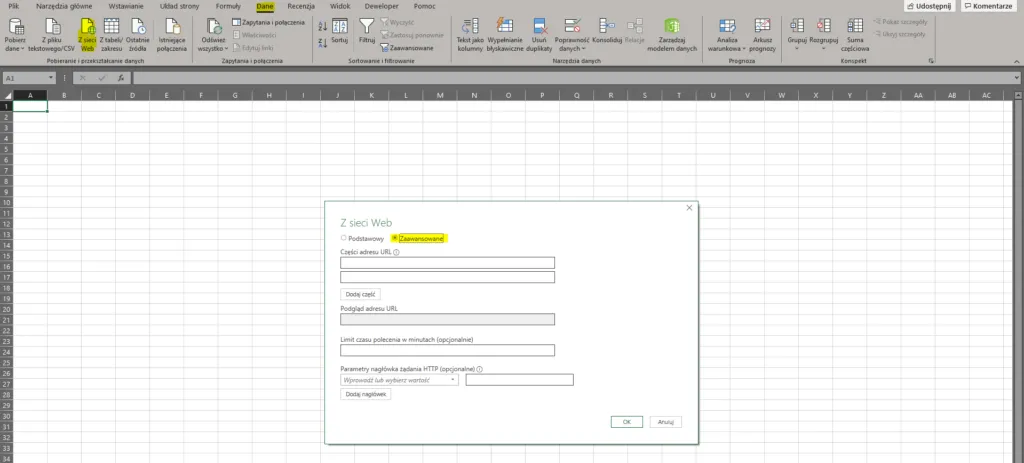
15. We fill in the fields following the pattern of the information we saved earlier:
In the URL part I set the limit to the highest value we can download, that is 5,000. It means we will download 5,000 entries:
https://svr9.supla.org/api/v2.3.0/channels/12792/measurement-logs?limit=**5000**
In the HTTP request header parameters (optional):
Accept application/json
Authorization Bearer NGU5OGI3MDkwNzk4NTlmMjY3YmRhZTE3NWM5NTBjMzQ0MmM3MjM3NDA4YjQ2YTQ0ZjVlNjAwY2YxMzA5NDcyOQ.aHR0cHM6Ly9zdnI5LnN1cGxhLm9yZw==
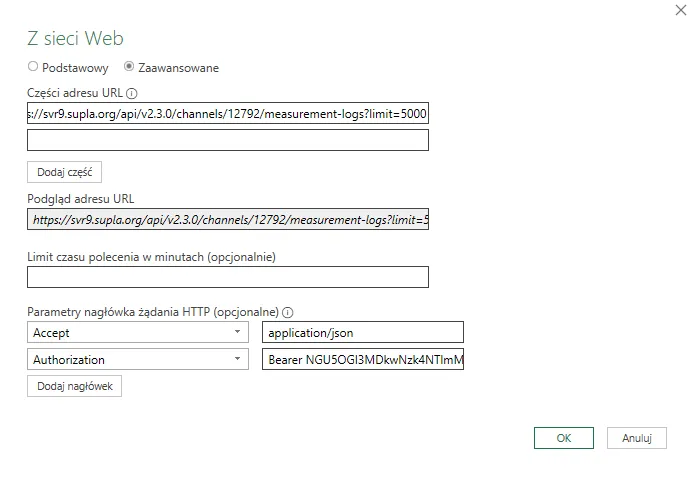
16. In the next step we can download the data into Excel by clicking OK. We should now see all the downloaded records in the List Tools window:
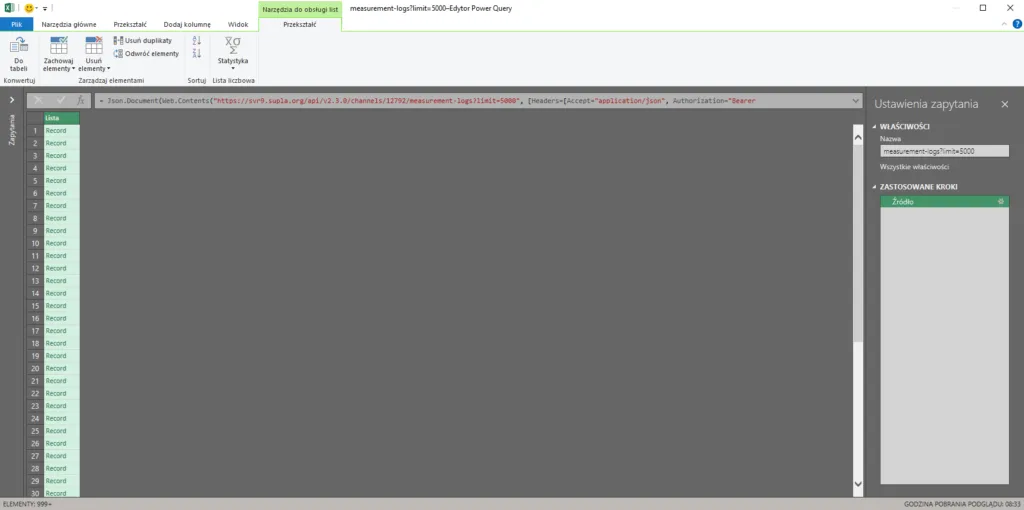
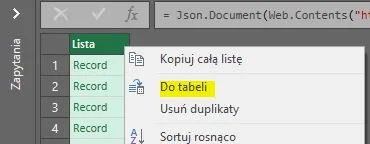
17. Ok, so how do we get this data into our Excel sheet? Here is the answer. We right-click the list of records and choose To Table:
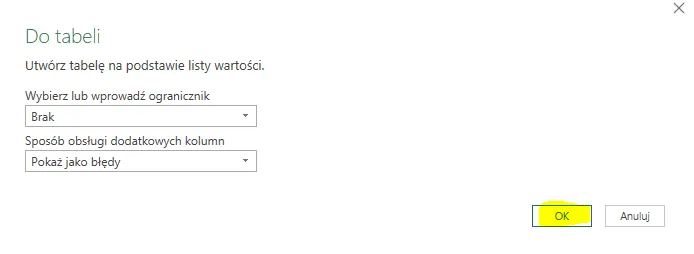
Then, in the next window, we choose OK:
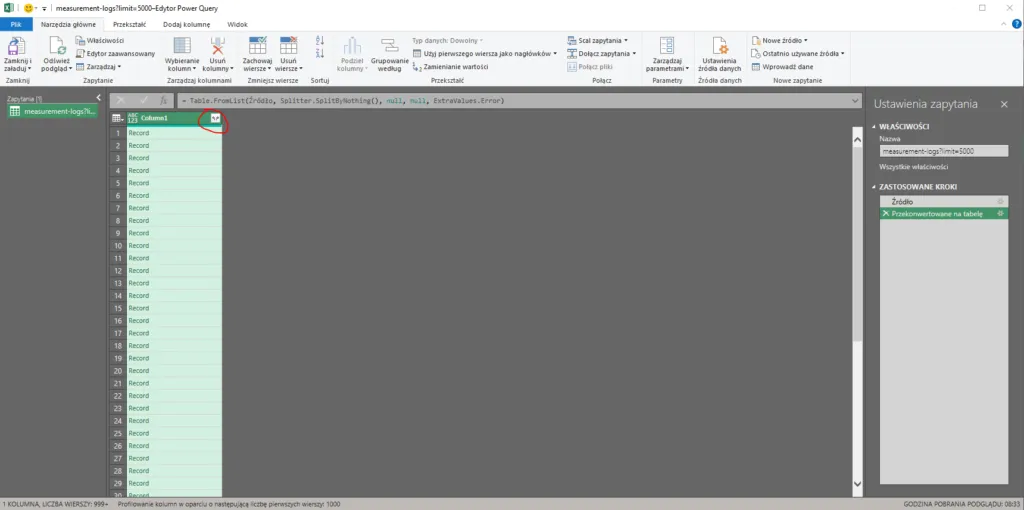
Our list has been converted into a table. Now we only need to expand the column to see all the results:
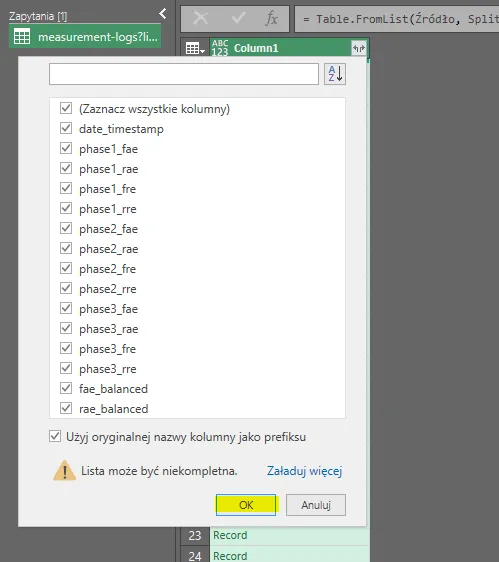
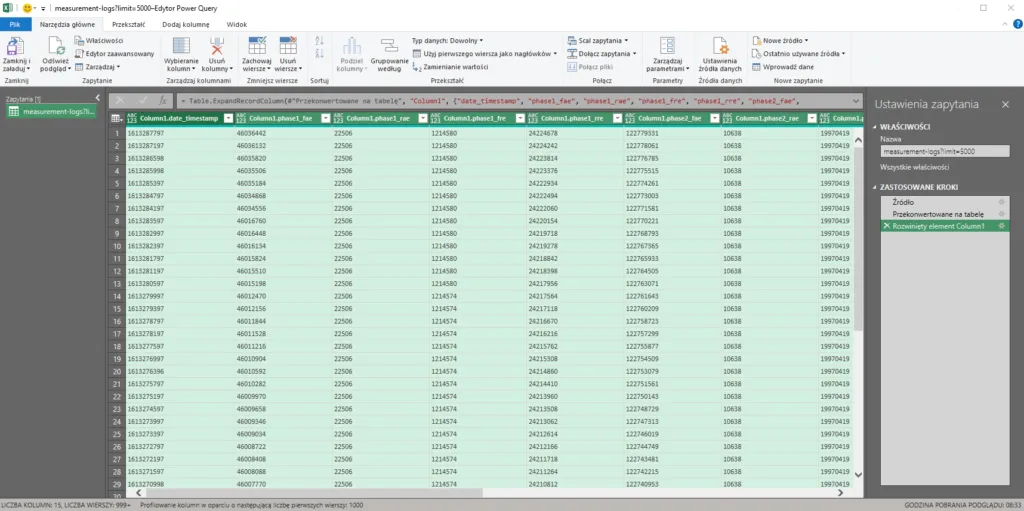
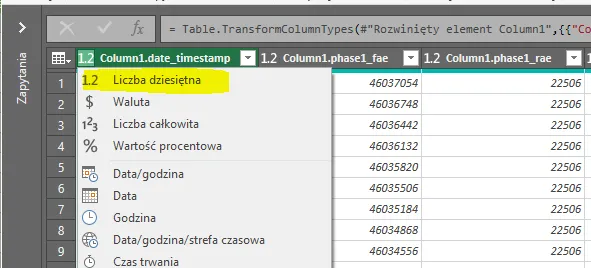
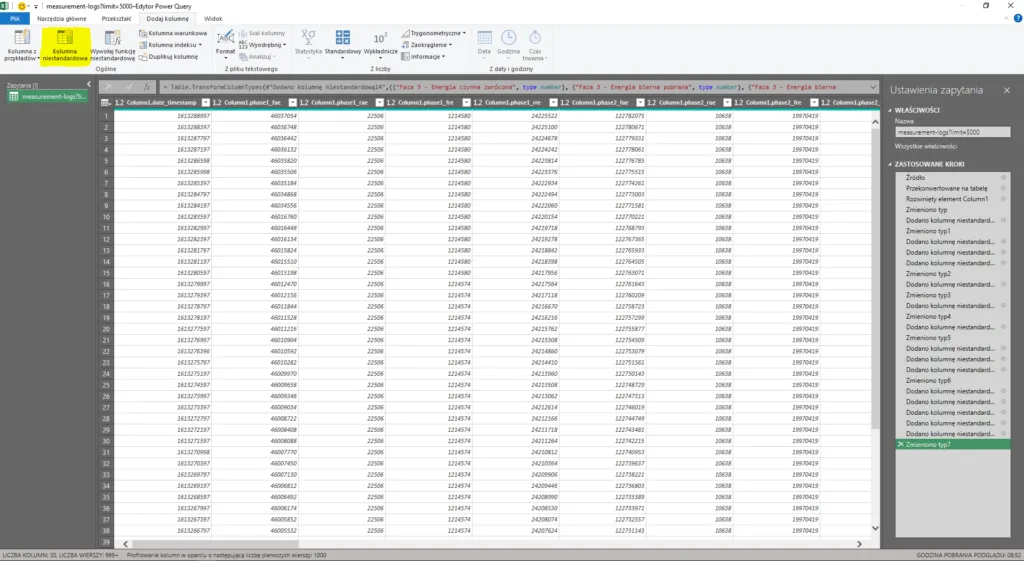
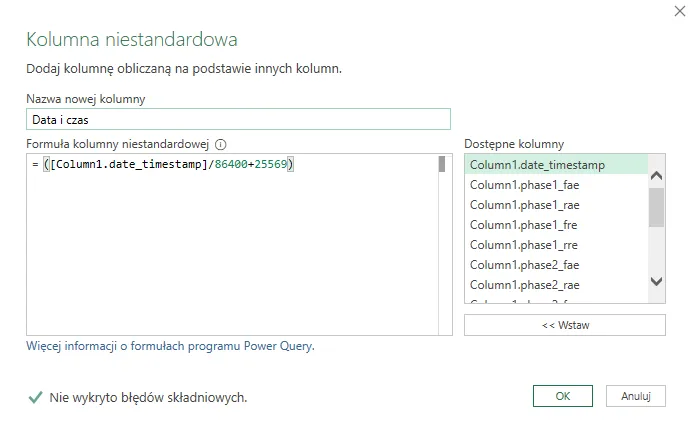
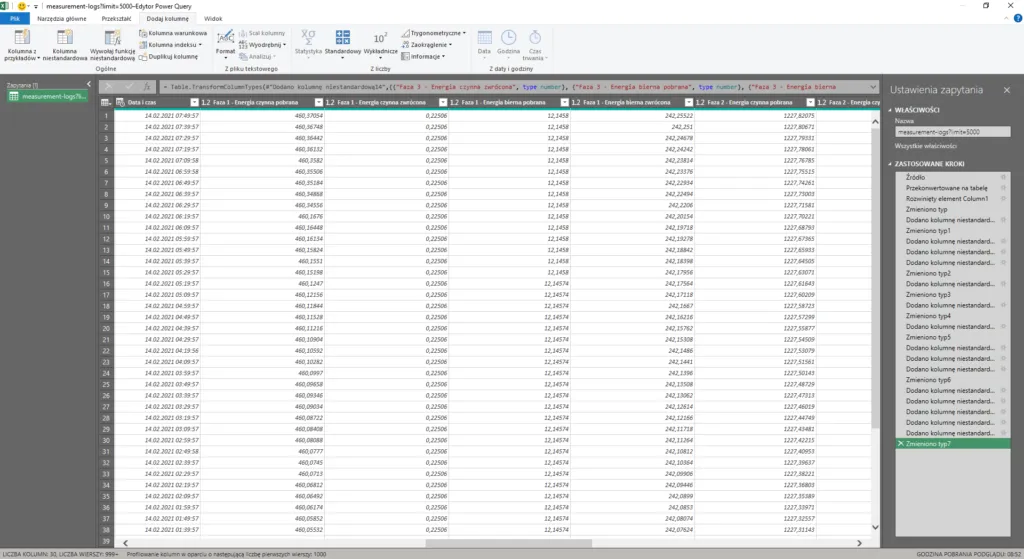
18. In the next step we change the data type of each column to a decimal number and rework our table. I used a simple conversion for the time; remember that you may still need to adjust it to the time zones. I will also add a few custom columns with the right functions, so that the data is easy to read:
19. That is all. You now know how to download the measurement history.
If you would rather set this up together with me, book an online Supla setup session. You share your screen and I guide you step by step. Sessions are in Polish.
Try my online measurement analyser too. It loads a CSV file with the measurement history of an energy monitor (MEW-01/MEW-02 from Supla Cloud) and shows usage in the ranges you pick, the hourly profile and a comparison of the G11 and G12 tariffs — everything is calculated locally in your browser, with no data sent anywhere. This is a beta version, so give it a try: Energy monitor measurement analyser.
New posts also go out over RSS — no email address needed. Subscribe via RSS