Home Assistant, Grafana and InfluxDB — data visualization
Grafana is a tool that lets you visualize data. See how to do it in Home Assistant, step by step, with an InfluxDB database.
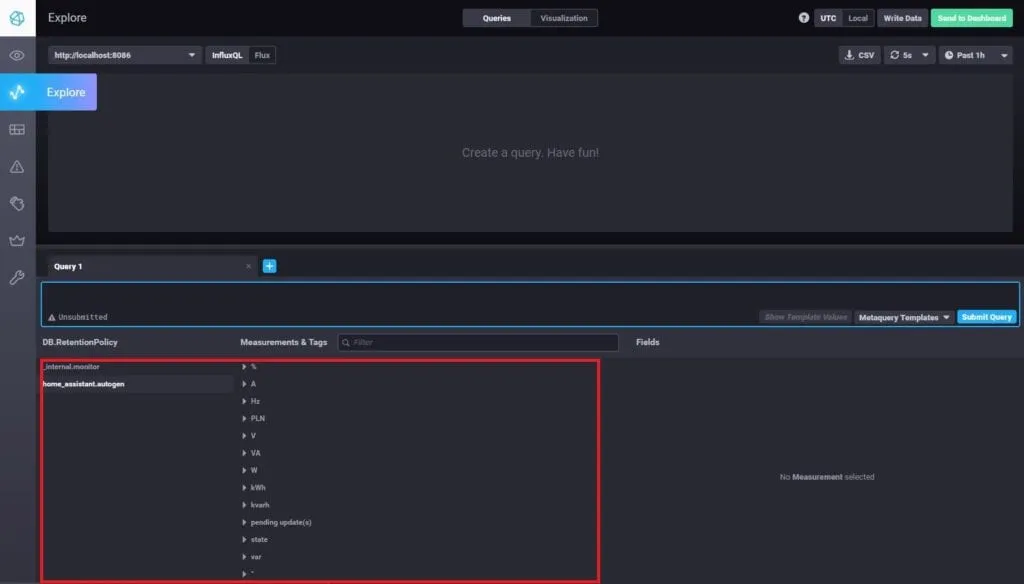
Table of contents
I work at ZAMEL. The devices described on this blog were provided to me by the company. All opinions and assessments are my own - the company had no influence on the content of the published articles.
Grafana is a very good tool for building clear charts of all the measurement data available in Home Assistant. In this post I will show you step by step how to configure Grafana in HA and present the data pulled into an InfluxDB database.
Installing InfluxDB and Grafana
We will start with installing the InfluxDB database, which will record the sensor values from Home Assistant. Then we will install Grafana.
1. We go to the Supervisor tab in the Home Assistant we set up earlier.
2. In the Add-on store tab we search for: InfluxDB and Grafana.
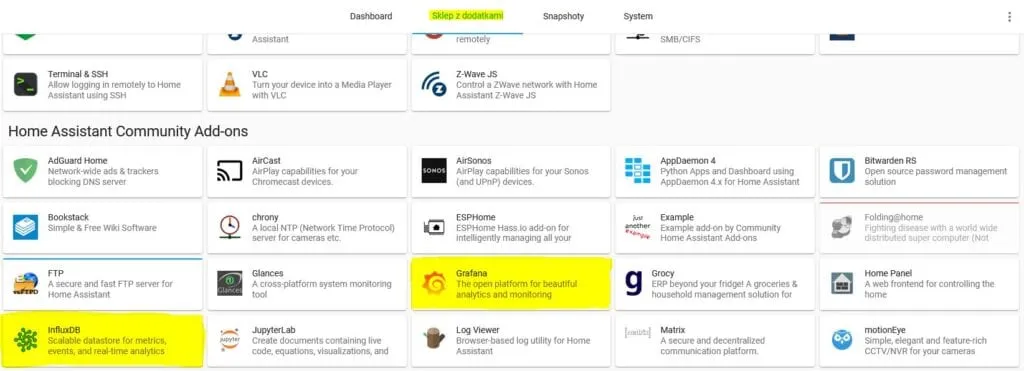
We install InfluxDB and Grafana in Home Assistant
3. We have to install each of these add-ons and then start it. After the installation I added each of them to the sidebar and set them to start with Home Assistant. This will surely come in handy when we restart the machine where Home Assistant is installed.
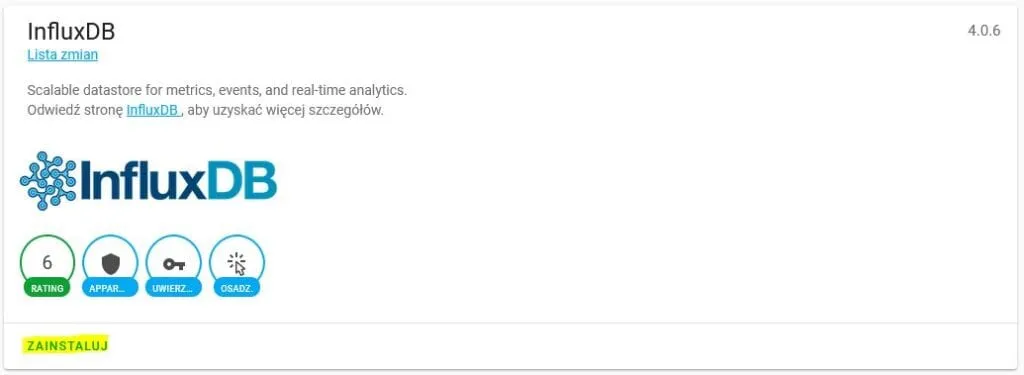
Installing InfluxDB in Home Assistant
4. After InfluxDB is installed we can start this add-on. We press the Start button.
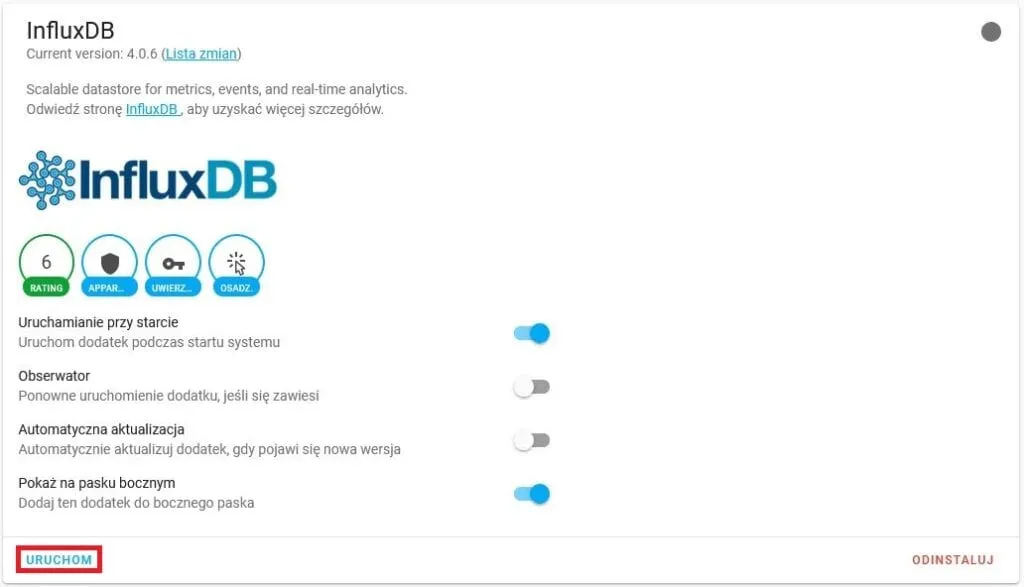
We start InfluxDB in Home Assistant
5. Now it is time for Grafana. We move on to the installation.
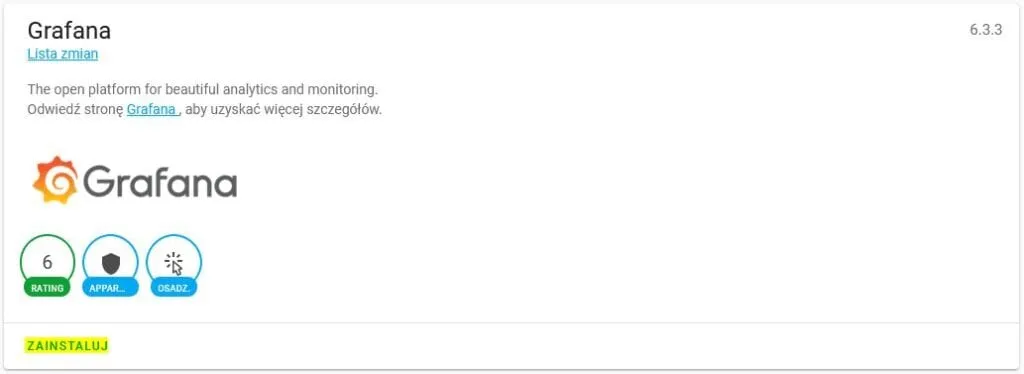
Installing Grafana in Home Assistant
6. After a moment the add-on will be installed. We start it, add it to the sidebar and tick the start on boot option.
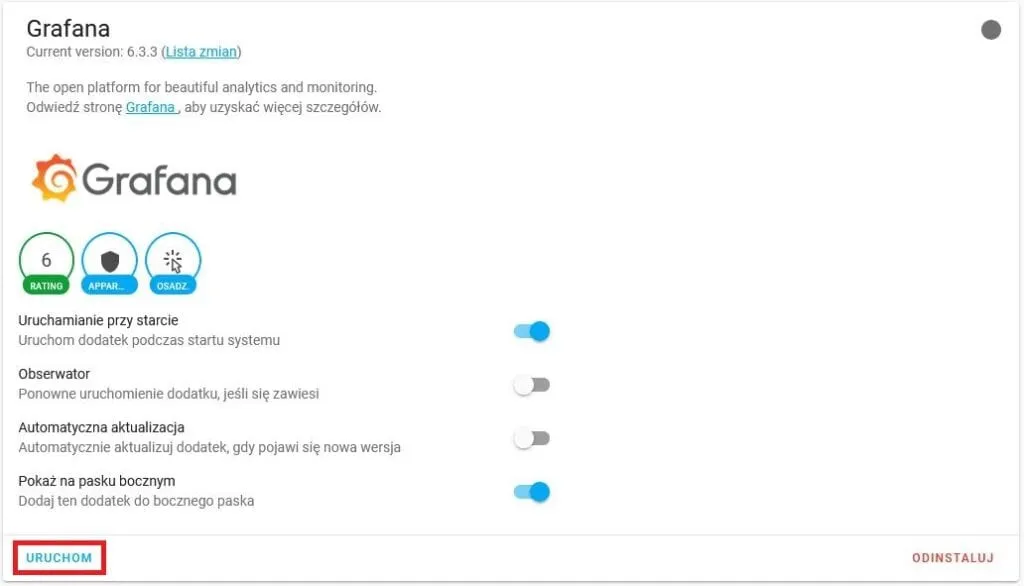
We start Grafana in Home Assistant
7. After starting the add-ons we have to wait a moment. Loading can take up to a few minutes. It all depends on the parameters of the machine where Home Assistant is installed.
InfluxDB configuration
First we will take care of the InfluxDB configuration. At this stage we will create our database and a user. The database will store the measurement data recorded in Home Assistant, for example temperature, humidity and so on. In my case I will show how the data from the MEW-01 device (an electricity monitor) is recorded.
- From the sidebar we choose InfluxDB and wait for this add-on to load.
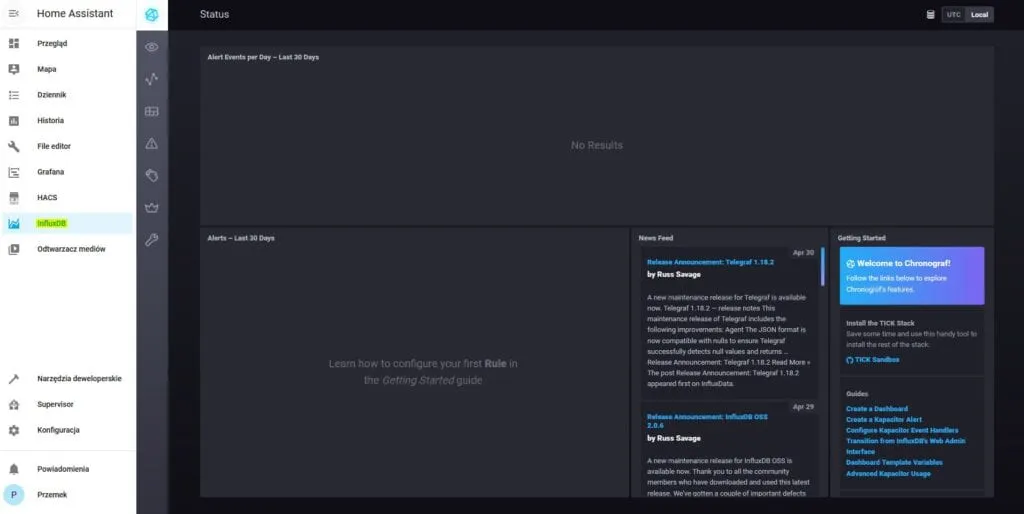
The first start of InfluxDB in Home Assistant
2. We go to the InfluxDB Admin tab. We will see a window with all the available databases.
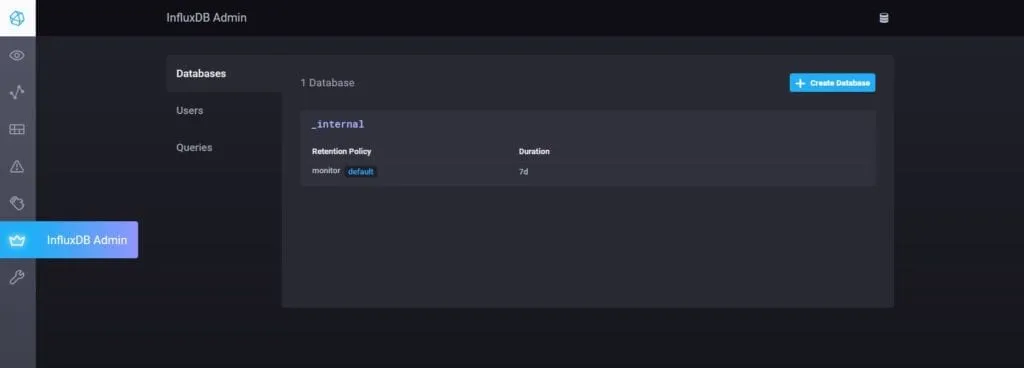
InfluxDB Admin
3. We create the database that will store the parameters of our sensors available in Home Assistant. We choose the Create Database option.
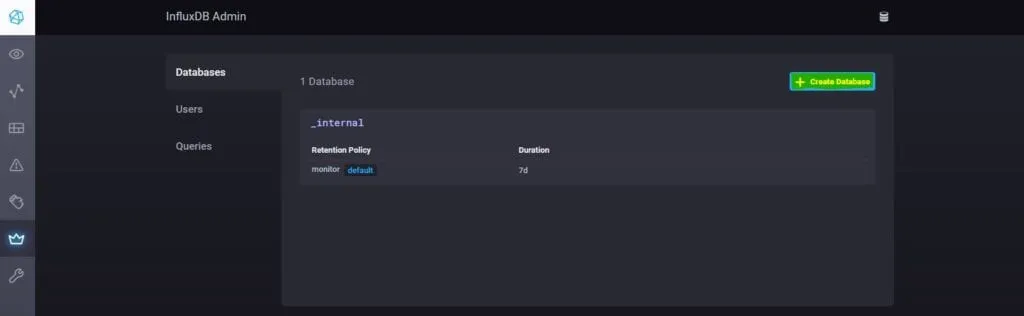
InfluxDB Admin - we create the database
4. We set the name of our database. For example homeassistant.
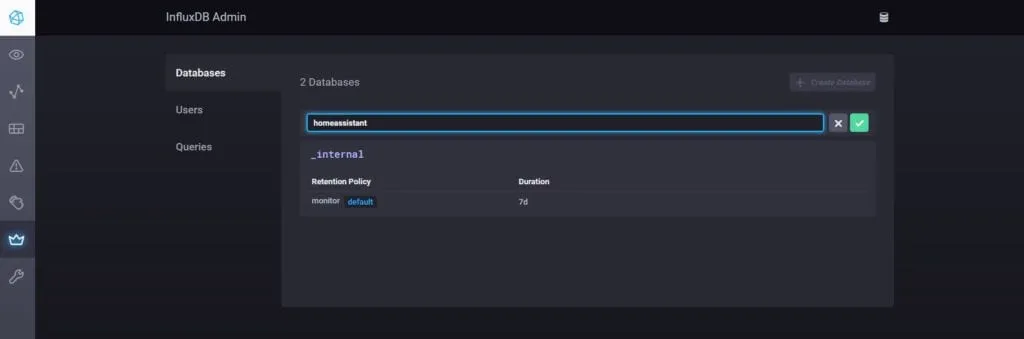
InfluxDB Admin - we create the database and confirm the choice
5. Once the database is created it will appear on the list, as below.
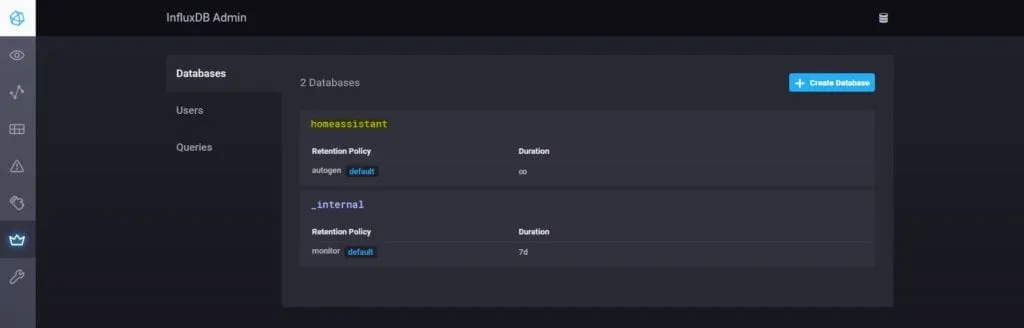
InfluxDB Admin - the new homeassistant database
NOTE!
Sometimes Home Assistant does not want to send data to the InfluxDB database. Reading the logs, I noticed that my Home Assistant refers to a database called home_assistant. Why? I have not found an answer to that question. I had to create a new database called home_assistant and everything started working correctly.
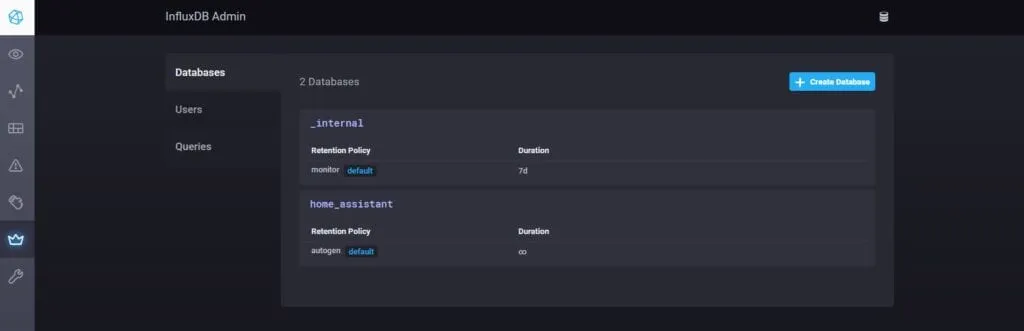
InfluxDB Admin - the new home_assistant database
6. Now it is time to create a user for our database. We choose the User tab and then the Create User button.
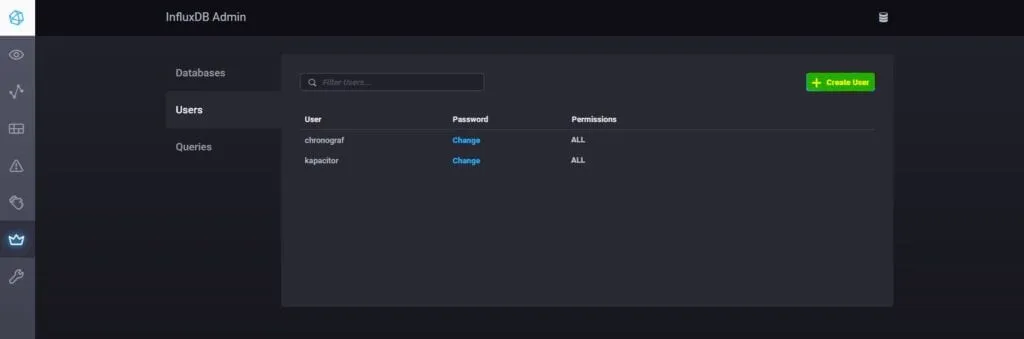
InfluxDB Admin - we create a user
7. We set a password.. It should be written down. We will need it in the Home Assistant configuration.
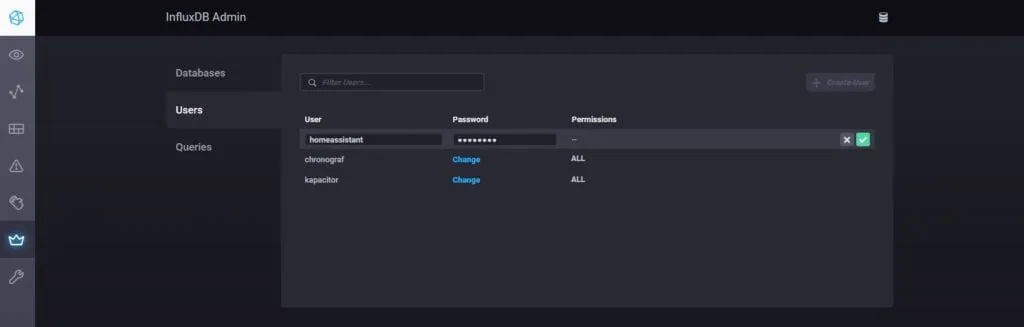
InfluxDB Admin - we create a user and confirm the choice
8. We give the new user all the permissions. We choose ALL and then Apply.
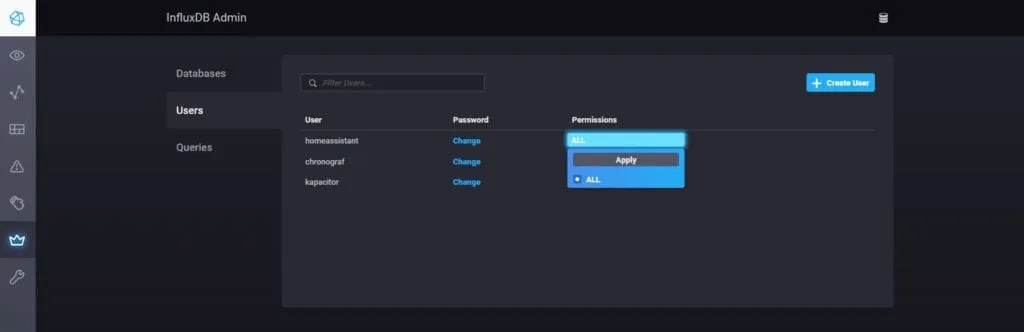
InfluxDB Admin - we grant the permissions to the user
9. The new user will appear on the list, as below.
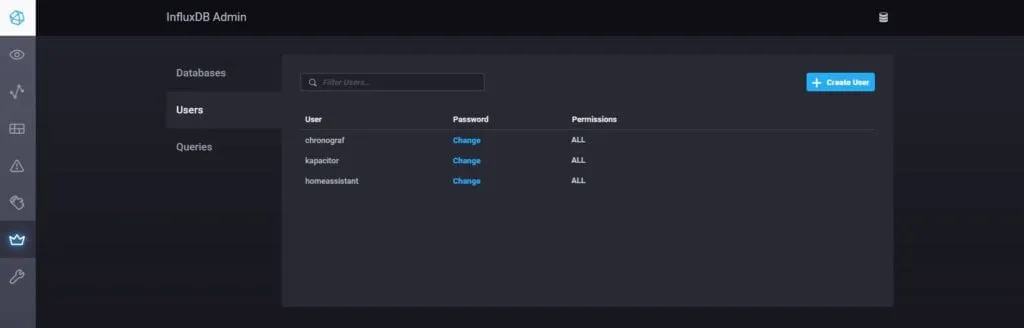
InfluxDB Admin - users
10. Time for the Home Assistant configuration. We open the configuration.yaml file (the easiest way is to use the File editor add-on. I wrote about this add-on in my previous post: Supla configuration for Home Assistant over MQTT) and we add the influxdb code.
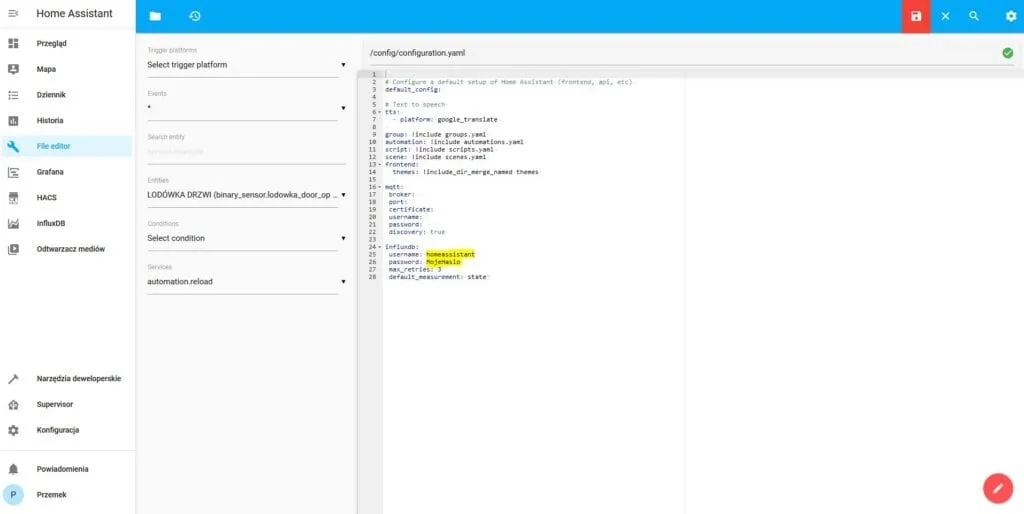
Home Assistant - configuring the configuration.yaml file to work with InfluxDB
In the line of code below we use the password we set when we created the new user of the InfluxDB database. Below is the code we can copy. All we have to do is swap in our own data.
influxdb:
username: homeassistant
password: MyPassword
max_retries: 3
default_measurement: state
Note!
It may happen that Home Assistant will not connect to InfluxDB. The reason can be a missing host. Here is the modified code:
influxdb:
host: OurHostName (e.g. a0u75994-influxdb)
port: 8086
username: homeassistant
password: MyPassword
max_retries: 3
default_measurement: state
We will find our host name in the details of the InfluxDB add-on in the Supervisor tab.
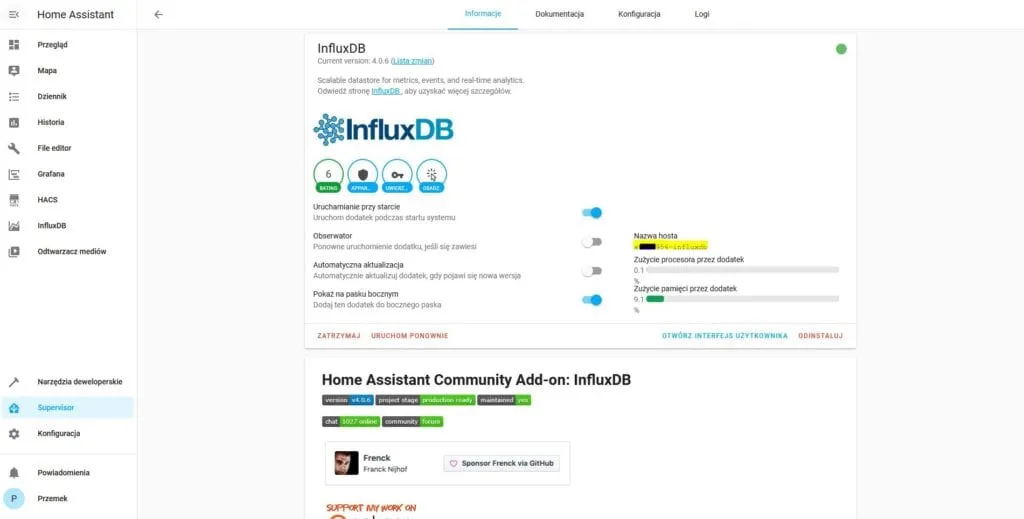
InfluxDB Admin - host name
11. After saving the configuration.yaml file we restart Home Assistant. After the restart we should see in InfluxDB all our measurement data from the sensors available in HA. Example data from the MEW-01 device below.
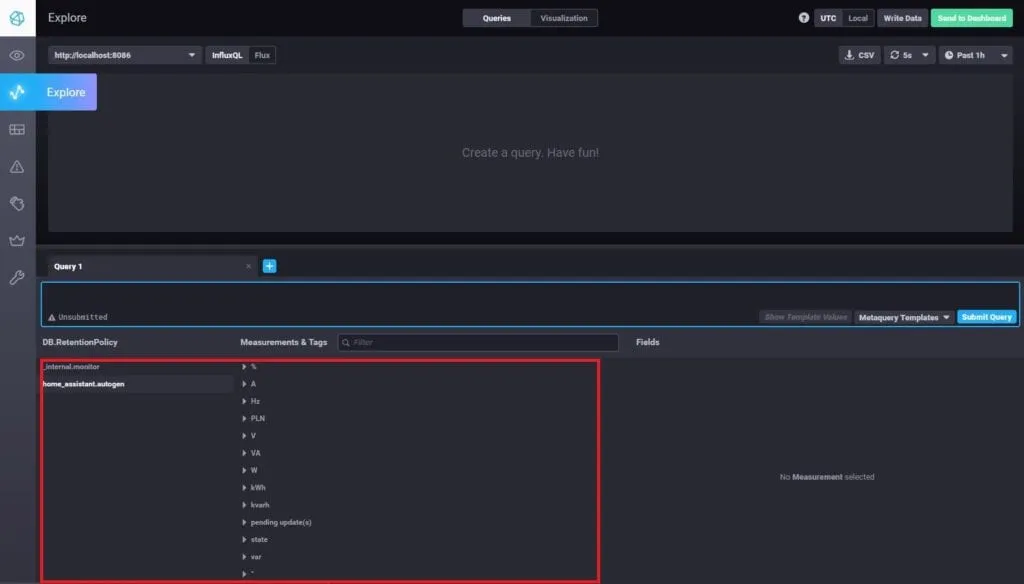
Home Assistant sends data to InfluxDB
Grafana configuration
- Time for the most enjoyable part. We go to our Grafana. We will add our first database. To do that we choose the Add your first data source button.
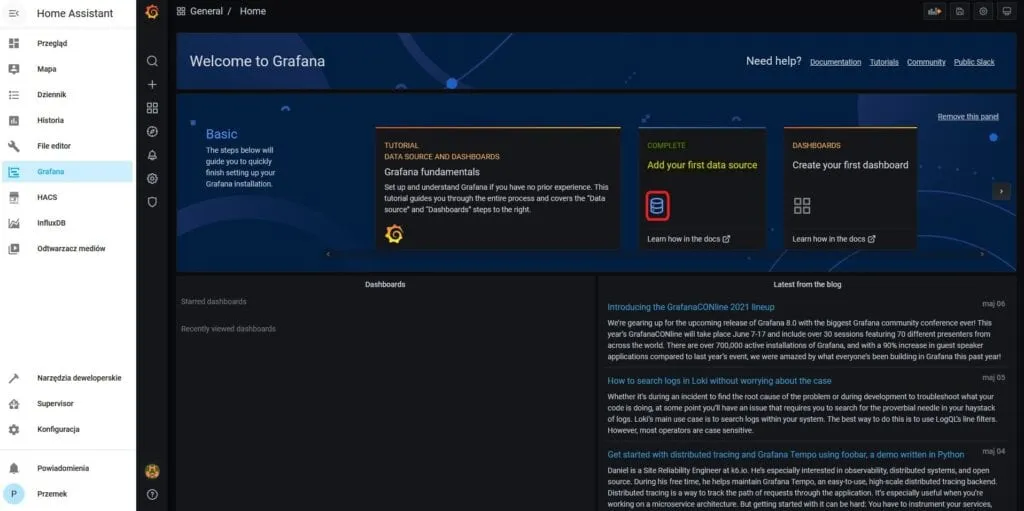
Grafana - we add a database
2. A list of available databases will show up. We choose InfluxDB.
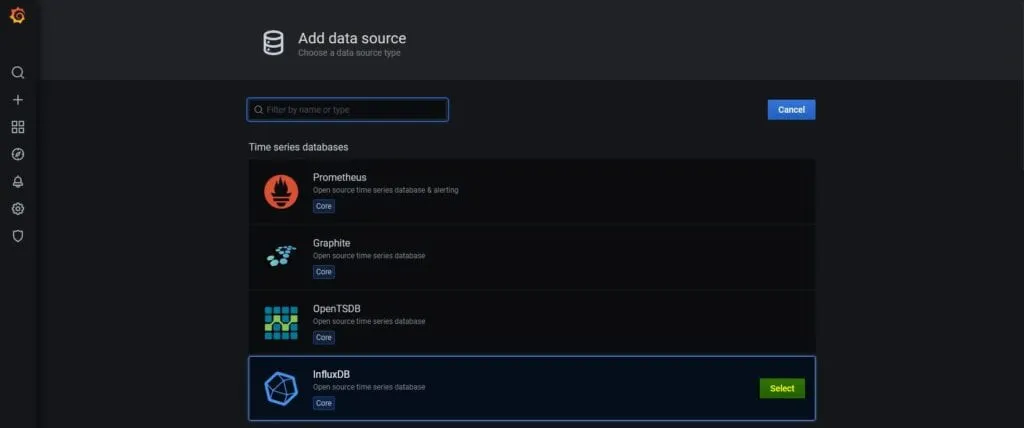
Grafana - we choose the InfluxDB database
3. In this step we give the address of our database. It can be http://localhost:8086 or the IP address where our Home Assistant runs. In my case it was 192.168.1.249:8086.
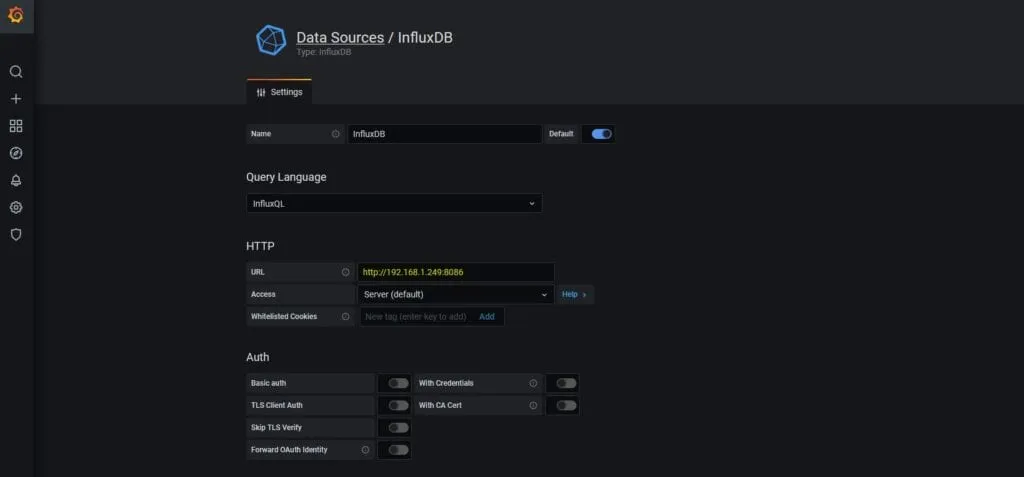
Grafana - InfluxDB configuration - IP address
4. Now it is time to enter the data of the database: name, user and password. We set the HTTP Method to GET.
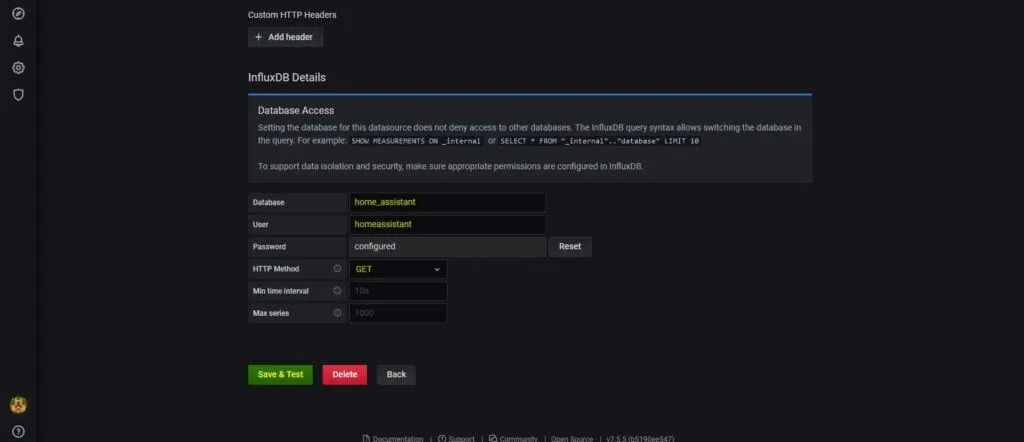
Grafana - InfluxDB configuration - database name, user name and password
5. After filling in the data we press the Save & Test button. If the data is correct we will see this message:

Grafana - the database has been configured correctly
6. Now it is time to create the first chart. We choose the plus and create our new dashboard.
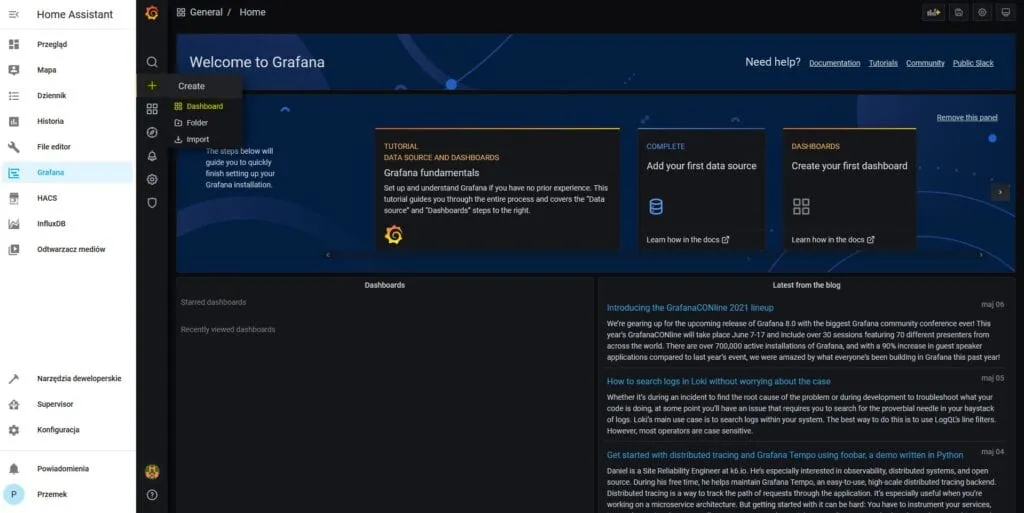
Grafana - we add the first panel
7. We press the Add an empty panel button and go to the configuration window of the first chart.
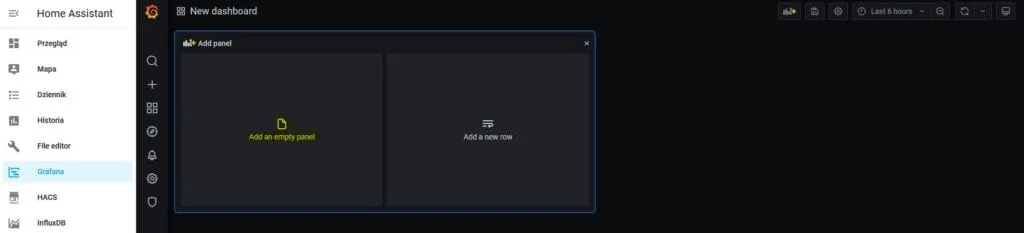
Grafana - we add a panel
8. In the query we set where the data should be taken from and which variable we would like to display.
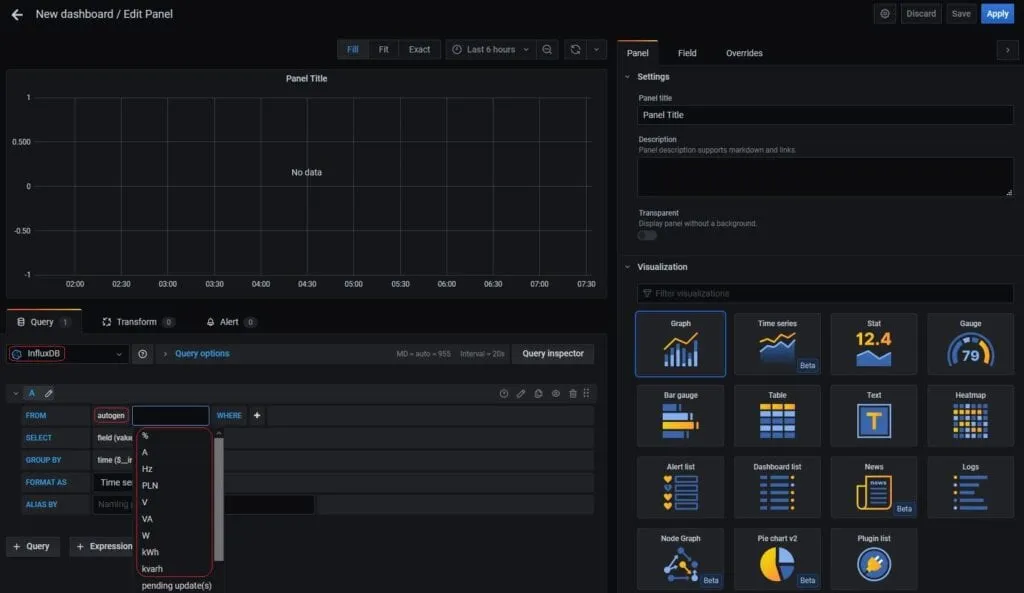
Grafana - example data shown on a chart
9. I chose the variable: voltage on phase L1 of the MEW-01 device and set its name. On top of that we can set parameters such as the unit, the number of decimal places and so on. In this article I will not go into that much detail.
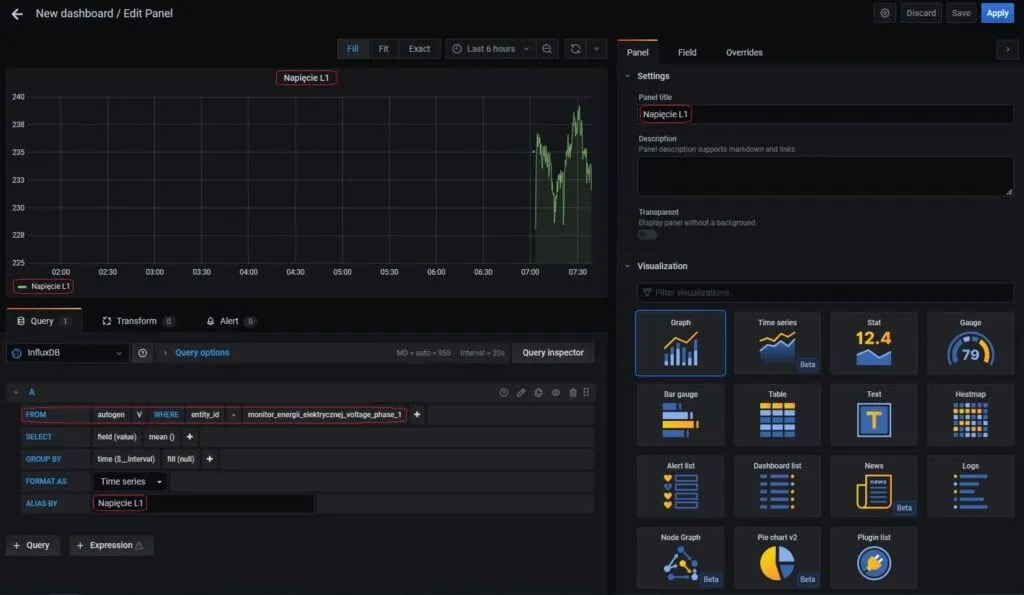
Grafana - MEW-01 voltage shown on a chart
10. We confirm the settings with the Apply button. After saving we will see our first chart.
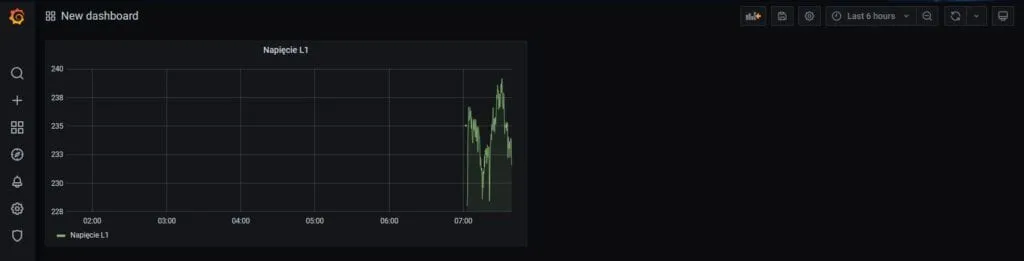
Grafana - an example voltage chart from MEW-01
11. At home I spent some time on it and built an example panel like this.
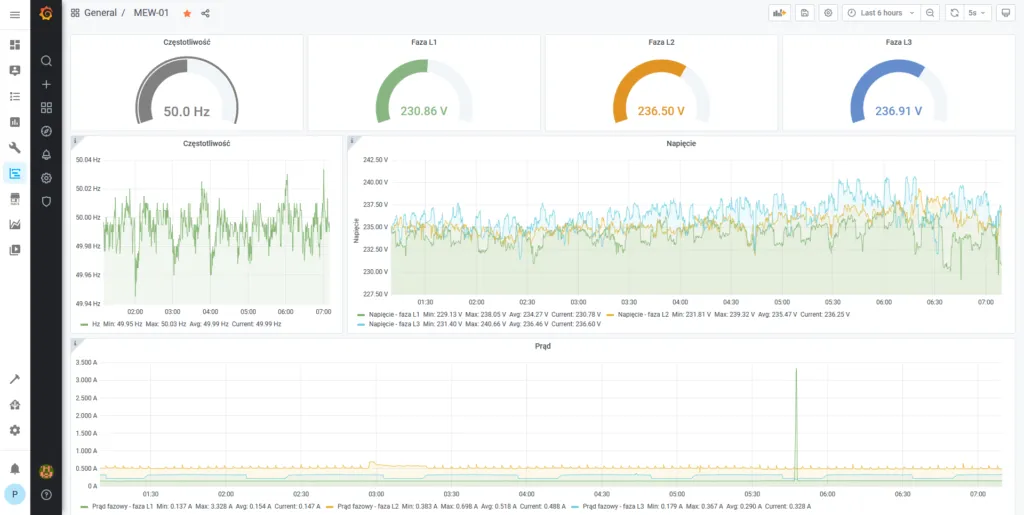
MEW-01 and Grafana in Home Assistant
That is all for today. Thank you for reading this post all the way to the end.
If you would rather set this up together with me, book an online Supla setup session. You share your screen and I guide you step by step. Sessions are in Polish.
New posts also go out over RSS — no email address needed. Subscribe via RSS